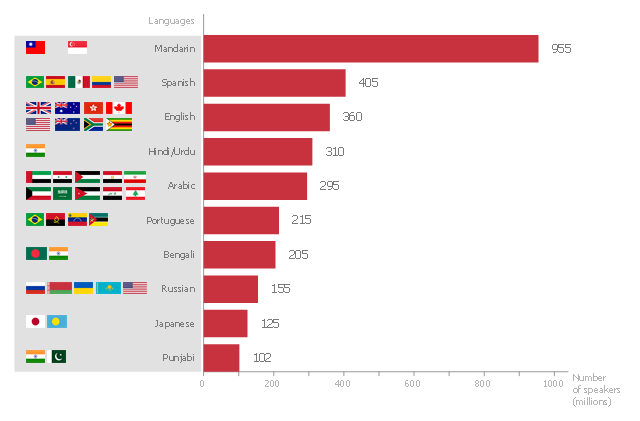
This bar graph sample shows the number of speakers for the most spoken languages of the world.
"In the philosophy of language, a natural language (or ordinary language) is any language which arises in an unpremeditated fashion as the result of the innate facility for language possessed by the human intellect. A natural language is typically used for communication, and may be spoken, signed, or written. Natural language is distinguished from constructed languages and formal languages such as computer-programming languages or the "languages" used in the study of formal logic, especially mathematical logic. ... Though the exact definition varies between scholars, natural language can broadly be defined in contrast on the one hand to artificial or constructed languages, computer programming languages like Python and international auxiliary languages like Esperanto, and on the other hand to other communication systems in nature, such as the waggle dance of bees. Although there are a variety of natural languages, any cognitively normal human infant is able to learn any natural language. By comparing the different natural languages, scholars hope to learn something about the nature of human intelligence and the innate biases and constraints that shape natural language, which are sometimes called universal grammar. The term "natural language" refers only a language that has developed naturally, and hence to actual speech, rather than prescribed speech. Hence, unstandardized speech (such as African American Vernacular English) is natural, whereas standardized speech such as Standard American English, which is in part prescribed, is somewhat artificial." [Natural language. Wikipedia]
The horizontal bar chart example "The most spoken languages of the world" was created using the ConceptDraw PRO diagramming and vector drawing software extended with the Bar Graphs solution from the Graphs and Charts area of ConceptDraw Solution Park.
Horizontal bar graph
Bar Chart

Bar Chart Software

Geo Map - South America Continent

 Basic Bar Graphs
This solution enhances ConceptDraw PRO v10.3.0 (or later) with templates, samples and a library of vector stencils for drawing Bar Graphs.
Chart Examples

Chart Templates

Bar Chart Examples

Geo Map - South America - Chile

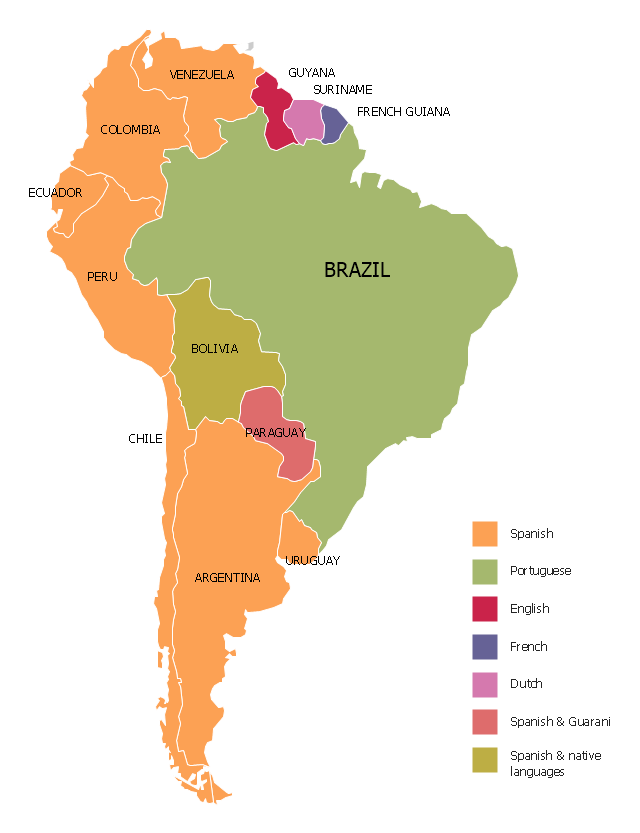
"Spanish and Portuguese are the most spoken languages in South America, with approximately 200 million speakers each. Spanish is the official language of most countries, along with other native languages in some countries. Portuguese is the official language of Brazil. Dutch is the official language of Suriname; English is the official language of Guyana, although there are at least twelve other languages spoken in the country, including Hindi and Arabic. English is also spoken in the Falkland Islands. French is the official language of French Guiana and the second language in Amapá, Brazil.
Indigenous languages of South America include Quechua in Ecuador, Peru, Chile, Argentina, Colombia, and Bolivia; Wayuunaiki in northern Colombia (La Guajira); Guaraní in Paraguay and, to a much lesser extent, in Bolivia; Aymara in Bolivia, Peru, and less often in Chile; and Mapudungun is spoken in certain pockets of southern Chile and, more rarely, Argentina. At least three South American indigenous languages (Quechua, Aymara, and Guarani) are recognized along with Spanish as national languages." [South America. Wikipedia]
The Languages of South America map example was redesigned from Wikimedia Commons file: Languages of South America (en).svg.
[commons.wikimedia.org/ wiki/ File:Languages_ of_ South_ America_ (en).svg]
This file is licensed under the Creative Commons Attribution-Share Alike 3.0 Unported license. [creativecommons.org/ licenses/ by-sa/ 3.0/ deed.en]
The Languages of South America map example was drawn using ConceptDraw PRO diagramming and vector drawing software extended with design elements library South America.
The Languages of South America map example is included in the Continent Maps solution from the Maps area of ConceptDraw Solution Park.
Thematic map - South America
What Is a Line Chart

Polar Graph

Waterfall Bar Chart

Chart Maker for Presentations

- The most spoken languages of the world | Languages of South ...
- The most spoken languages of the world | Chart Examples | Chart ...
- The most spoken languages of the world | Bar Chart Software | Bar ...
- The most spoken languages of the world | Bar Chart | Bar Chart ...
- The most spoken languages of the world
- The most spoken languages of the world | Bargraph Speech ...
- The most spoken languages of the world
- Languages of South America - Thematic map | The most spoken ...
- The most spoken languages of the world | Language Learning | FSM ...
- The most spoken languages of the world | Geo Map - Asia ...
- Horizontal bar chart - The most spoken languages of the world ...
- The most spoken languages of the world | Scientific Symbols Chart ...
- Histogram Of Languages Spoken
- Languages of South America - Thematic map | South America ...
- Bar Chart | Bar Chart Software | Bar Graphs | Most Speaking ...
- Venn Diagram For Most Spoken Language In The World
- Bar Chart Software | Bar Chart | Bar Graphs | Most Spoken Language
- Languages of South America - Thematic map | Geo Map - South ...
- Languages of South America - Thematic map | Brazil in South ...