How to Deliver Presentations using Mind Maps
Creating and organizing presentations, structuring received presentations, presenting mind maps, and preparing for public presenting.HelpDesk
How to Convert a Mind Map into MS Word Document
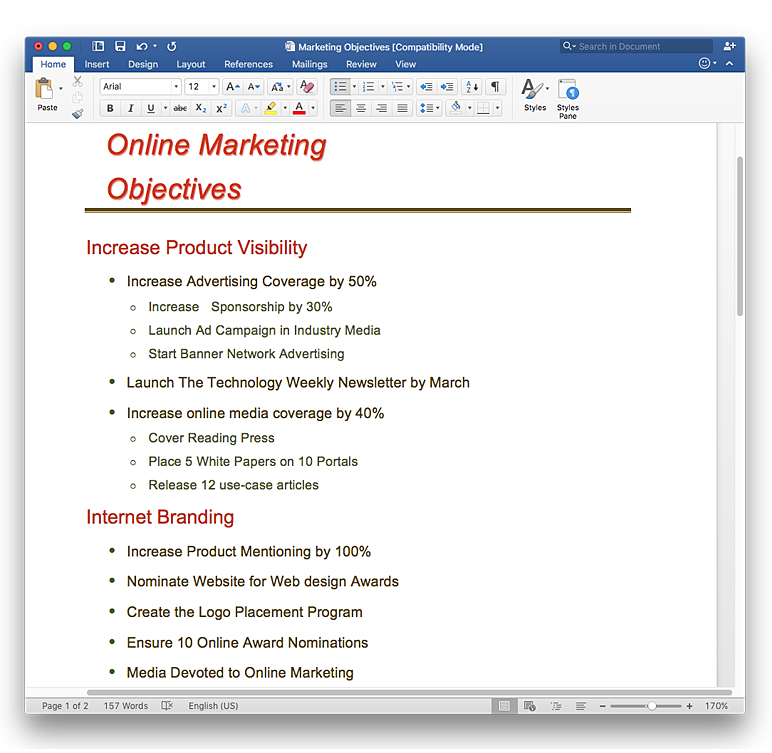
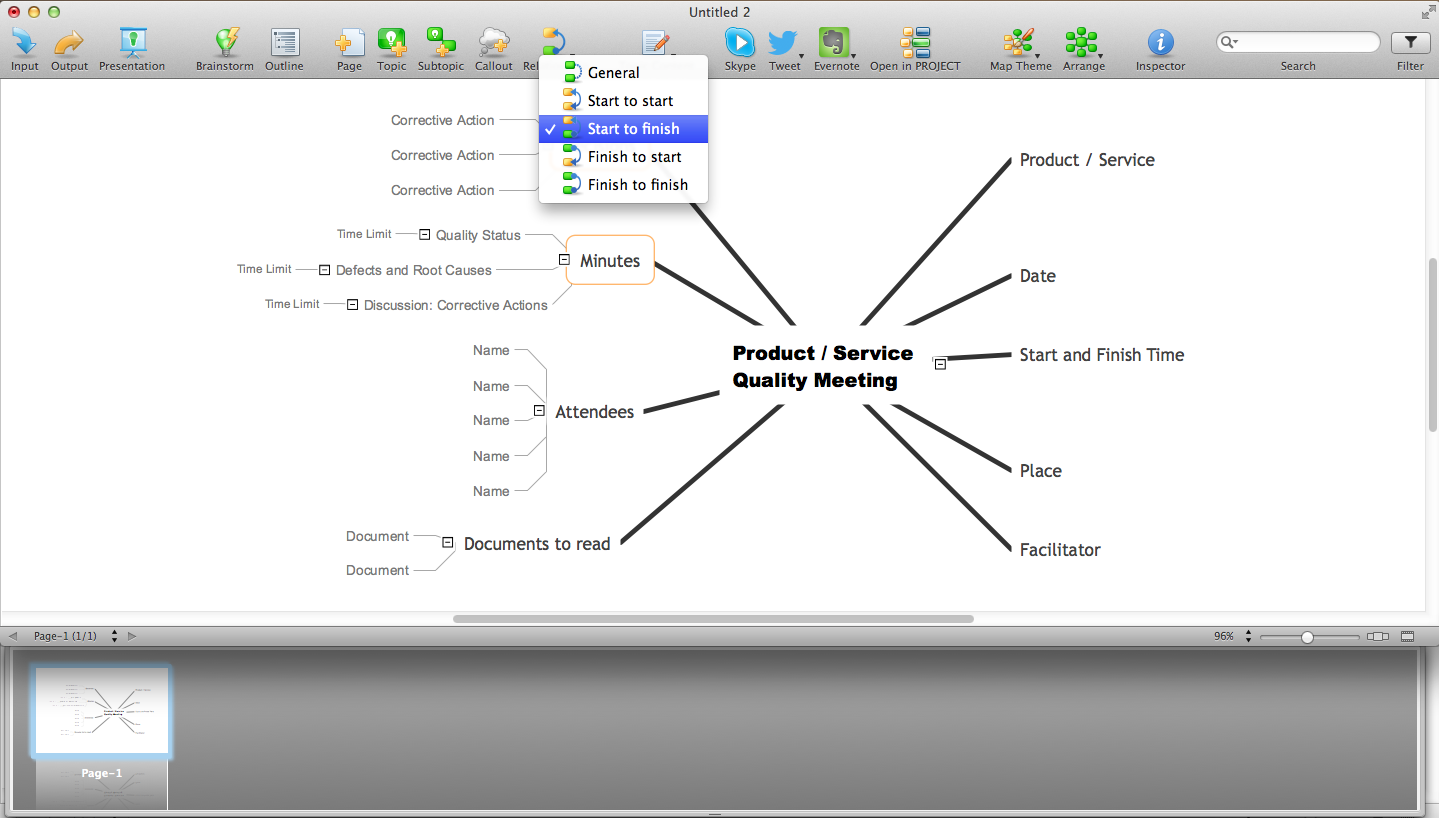
Mind maps are often used for structuring ideas, planning and organizing of various documents. ConceptDraw MINDMAP allows you transfer a mind map to MS Word format using its export facilities. You can convert a mind map to a MS Word outline using the set of standard templates, or even your custom template. Thus, your mind map will be transformed into the proper document format. Using a custom MS Word template allows you apply your individual style to each document, being exported from ConceptDraw MINDMAP. You can use a mind mapping to capture ideas and structure information. Then making a quick conversion to MS Word and you finally obtain a clean and stylish document.How to show a mind map presentation via Skype
Video tutorials on ConceptDraw products. Try it today!Skype Presentation - How To
Video tutorials on ConceptDraw products. Try it today!Blank Calendar Template
The calendars around us everywhere in the modern world. There are a lot of calendar types, each of them has its own assignment: Business calendar, Personal calendar, Economic calendar, Financial calendar, Daily calendar, Monthly calendar, and many other useful calendar types. ConceptDraw PRO offers you the possibility to make your own unique calendars on the base of the Blank Calendar Template which is included to the Calendars Solution from the Management Area.Fishbone Diagram Template
A causal model is an abstract concept, that describes the causal mechanisms of a system, by noting certain variables and their influence on each other, in an effort to discover the cause of a certain problem or flaw. This model is presented in diagram form by using a fishbone diagram. ConceptDraw PRO diagramming and vector drawing software enhanced with Fishbone Diagrams solution helps you create business productivity diagrams from Fishbone diagram templates and examples, that provide to start using of the graphic method for the analysis of problem causes. Each predesigned Fishbone Diagram template is ready to use and useful for instantly drawing your own Fishbone Diagram.Why People Select ConceptDraw MINDMAP
Why people select ConceptDraw MINDMAP? Undoubtedly it is the best alternative to MindJet MindManager. Among the advantages of ConceptDraw MINDMAP are: powerful and unique tools for brainstorming, outlining, taking notes, making detailed Mind Maps and relationship maps; the personal license that gives the ownership on the product for the product's life and allows a concurrent Mac and Windows installation; the absence of obligatory subscription on renewal; regularly updates with new features, templates and low upgrade costs; free technical support and better service for a lower cost. Besides, ConceptDraw MINDMAP provides the operating system migration and compatibility with other ConceptDraw products. It is a cross-platform software for the use on Mac and Windows machines simultaneously according to your preferences. The opening of ConceptDraw MINDMAP document in ConceptDraw PROJECT application turns the outline into a project, now you can add resources and due dates, edit the tasks to make a robust and easily-deciphered project. Discover today what these benefits mean to you.Presenting Documents with Remote Presentation for Skype Solution
Video tutorials on ConceptDraw products. Try it today!HelpDesk
How to Track Your Project Plan vs. the Actual Project Condition
Conceptdraw PROJECT provides user with the possibility to track how the project is going. Project Manager can compare the actual data with the planned and assess possible measures to resolve issues. Conceptdraw PROJECT has several types of visual reports that can help to assess visually the difference between planned and actual project data.Business Productivity - Marketing
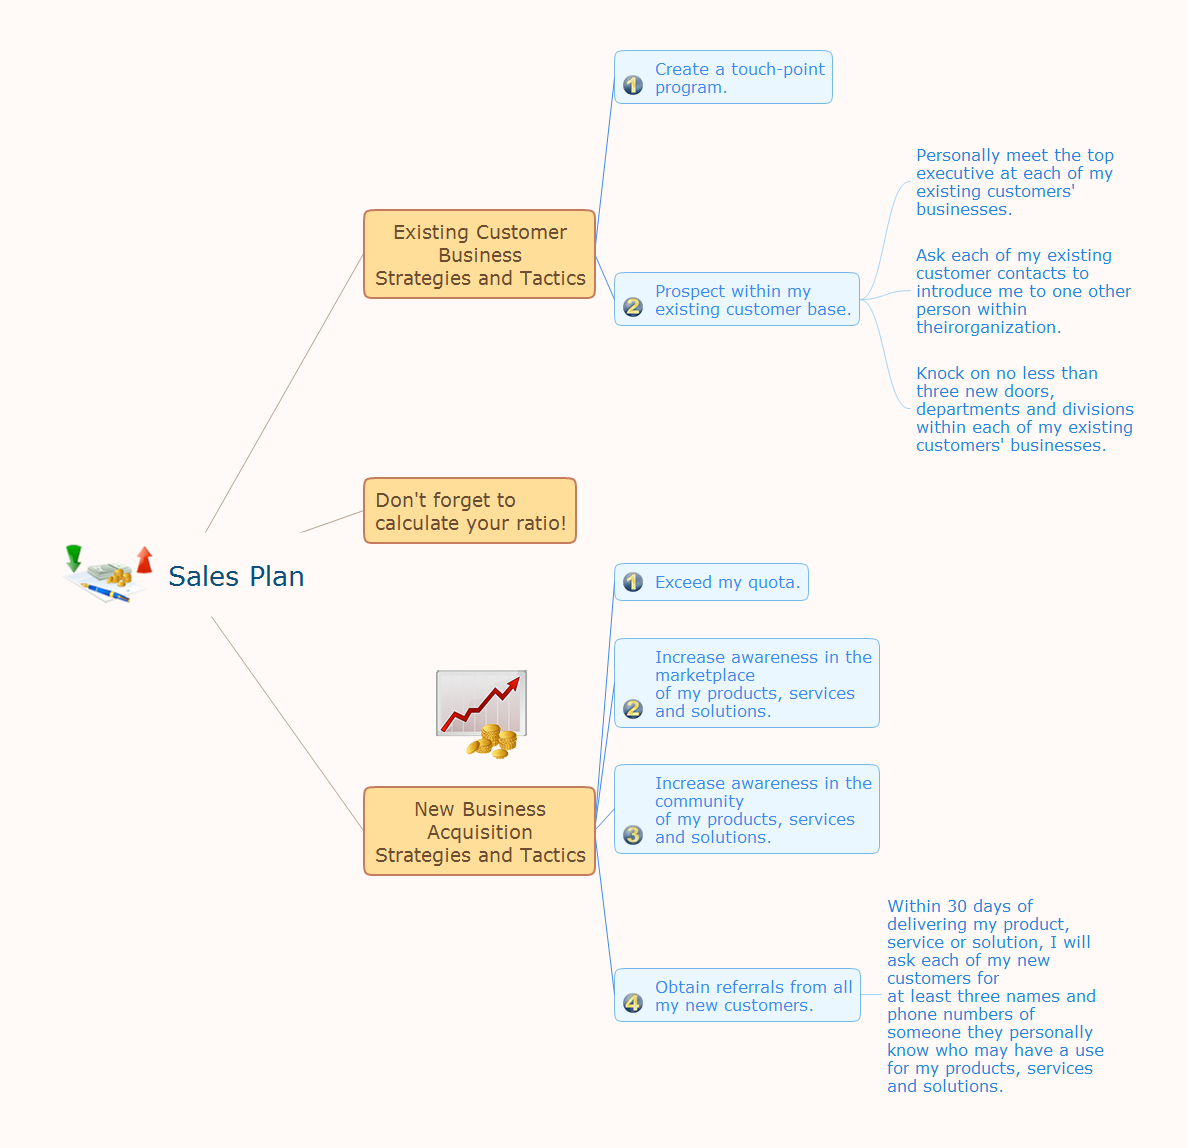
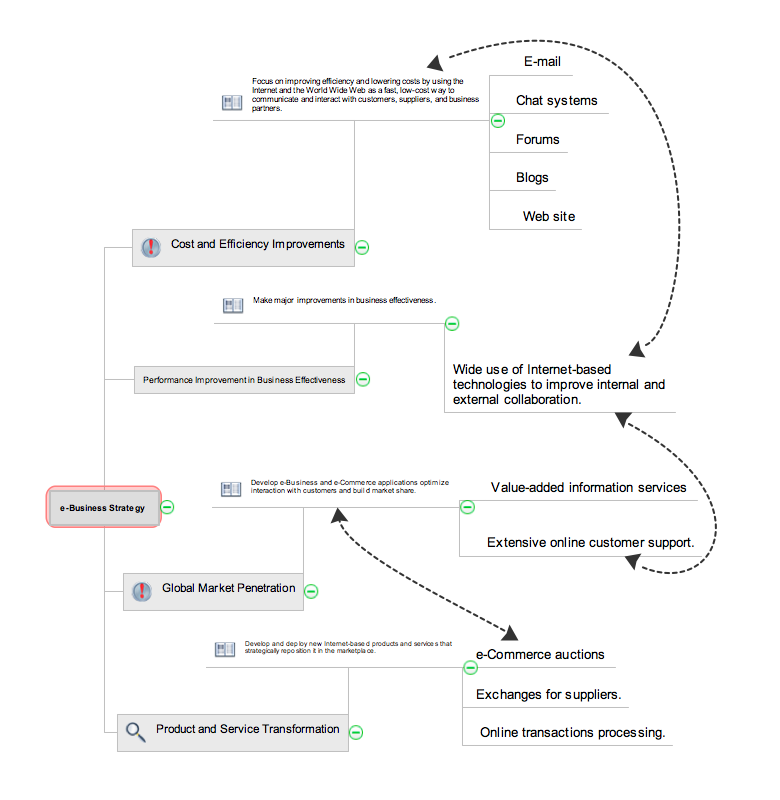
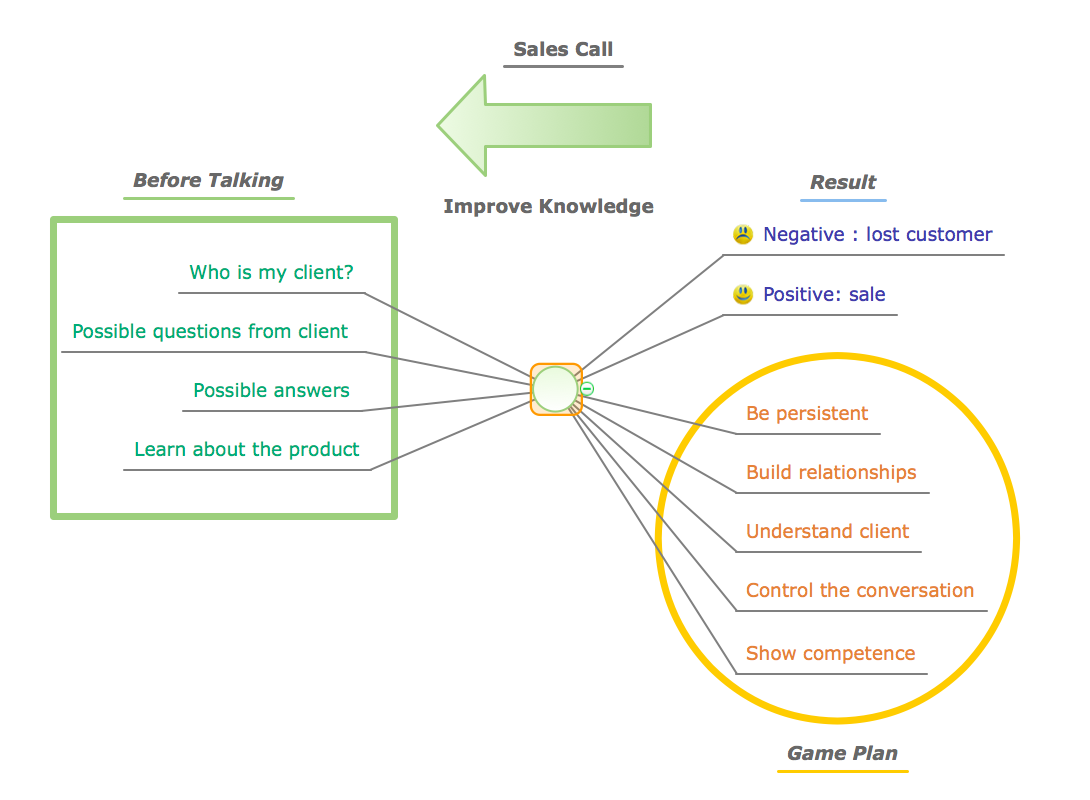
Mind Map is effective tool for depiction the main idea and related concepts, and representation a thought process. Mind Maps have essential value in marketing field, advertising and sales. They help successfully accomplish marketing goals and easy get marketing answers, to achieve a sustainable competitive advantages and increasing sales. Mind Maps help in new product development, they allow to generate and structure ideas about its properties and features, to define the target customers, brainstorm the key words and phrases for advertising and sales materials. ConceptDraw MINDMAP is a perfect marketing diagramming and marketing strategy tool that help accomplish marketing goals, represent marketing information and easy design Marketing Mind Maps and Marketing Diagrams (Marketing Step Chart, Marketing Mix Diagram, Market Environment Analysis Charts, Sales Pyramids, Target and Marketing Scope Diagrams, Feature Comparison Chart, Product Position Map, Products Comparison Chart, Timeline, SWOT, Boston Growth Matrix, Ansoff Product-Market Growth Matrix) for further using in visual documents and presentations.Risk Diagram (Process Decision Program Chart)
The risk is a probable event in result of which may occur the negative events and adverse consequences. The risk management is a very important process in any field, it is a process of making the management decisions aimed on the reducing the likelihood of appearing the unfavorable results and on the minimizing potential losses, as well as the implementation of these solutions. The main purpose of applying the risk management is increasing of enterprise's competitiveness with help of protection against the risks. ConceptDraw MINDMAP software is perfect for identifying the risks, analyzing and managing risks, for designing Risk Diagrams, for developing effective actions in response to circumstances and potential obstacles that were identified as risks. It is also the best for designing Process Decision Program Charts and representing the PDPC method, which is effective way of detailed planning and depiction the whole sequence of actions on the path from the formulation a problem to its solution. The PDPC lets determine the risks when corrective actions are not performed correctly and helps develop descriptions for preventive actions.Computer Hardware - Reseller Business Plan
When developing a business plan it is very important to accurately represent the structure and visually outline all important information. A business plan usually has a clear hierarchical structure. The Mind Maps are particularly effective to describe such structures, they are one of the most powerful and visually intuitive tools for the tasks of structuring and memorizing large amounts of information. The Mind Maps are indispensable in development the complex projects, in preparation and discussion of business plans, in designing the presentations, in process of decision making, holding brainstorming, time management, etc. As for the software for working with Mind Maps, particularly effective is a cross-platform ConceptDraw MINDMAP software for Windows and Mac OS X. It provides many tools that help in business plan preparation for organizing the new business, in developing a business plan for promotion some product, etc. ConceptDraw MINDMAP supports the multipage documents, the export and import into popular applications MS PowerPoint, MS Word, PDF, MindManager, in project management applications ConceptDraw Project and MS Project, and in various graphical formats. You can to observe a Mind Map of a business plan for computer hardware reseller designed in ConceptDraw MINDMAP.
 Target and Circular Diagrams
This solution extends ConceptDraw PRO software with samples, templates and library of design elements for drawing the Target and Circular Diagrams.
Sales Dashboards for Your Company
ConceptDraw PRO software extended with the Sales Dashboard solution allows you produce sales dashboards for your company easily. You can start from samples and templates delivered with the solution and then modify them to get a dashboard that suites your specific needs.Financial Comparison Chart
This sample shows the Bar Chart of the leverage ratios for two major investment banks. The leverage ratio is the ratio of the total debt to the total equity; it is a measure of the risk taken by the bank. The higher of the leverage ratio denotes the more risk, the greater risks can lead to the subprime crisis.- Monthly Report Ppt Template
- Free Ppt Sample Templates With Graphs And Charts
- Monthly Report
- Chart Maker for Presentations | Percentage Pie Chart. Pie Chart ...
- Comparison Template Powerpoint
- Chart Maker for Presentations | Business Report Pie. Pie Chart ...
- Comparison Template Ppt
- Sales Growth. Bar Graphs Example | Financial Comparison Chart ...
- Monthly Project Dashboard Template
- Spider Chart Template | Chart Maker for Presentations | Percentage ...
- Bar Chart Template for Word | Chart Maker for Presentations | How ...
- Powerpoint Template Comparison Table
- Bar Diagram Of Monthly Rainfall Image In Bar Graph
- Spider Chart Template | Diagrams Mean Nothing | Chart Maker for ...
- Powerpoint Bar Chart Templates
- Spider Chart Template | Radar Chart | Percentage Spider Chart ...
- Feature Comparison Chart Software | Bar Chart Template for Word ...
- Chart Maker for Presentations | Percentage Pie Chart. Pie Chart ...
- Blank Calendar Template | Fishbone Diagram Template | Fishbone ...
- Matrix Organization Structure | Blank Calendar Template ...
