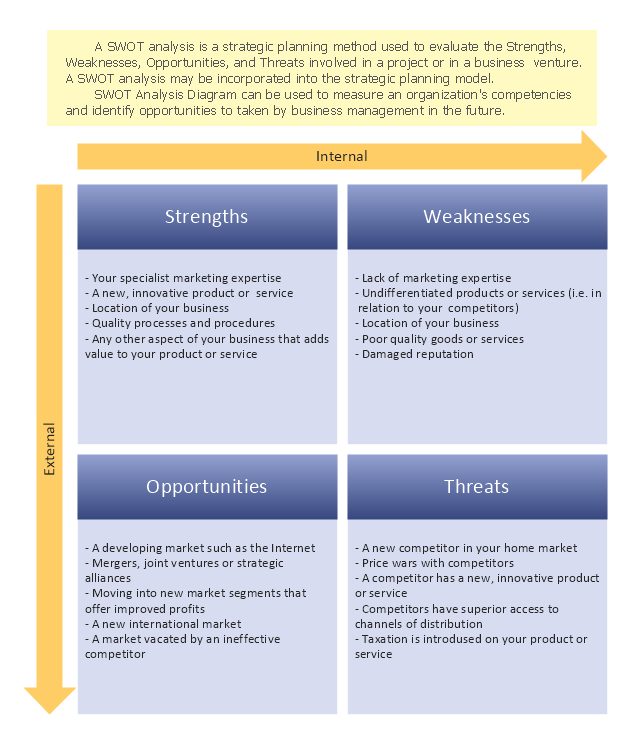
SWOT analysis is a strategic planning method for evaluation of Strengths, Weaknesses, Opportunities, and Threats of a project or a business venture. It may be the part of strategic planning model. SWOT Diagrams are used to measure an organization's competencies and identify opportunities to taken by management in the future.
This SWOT analysis matrix diagram template for the ConceptDraw PRO diagramming and vector drawing software is included in the SWOT Analysis solution from the Management area of ConceptDraw Solution Park.
This SWOT analysis matrix diagram template for the ConceptDraw PRO diagramming and vector drawing software is included in the SWOT Analysis solution from the Management area of ConceptDraw Solution Park.
SWOT matrix template
"SWOT Analysis.
A tool that identifies the strengths, weaknesses, opportunities and threats of an organization. Specifically, SWOT is a basic, straightforward model that assesses what an organization can and cannot do as well as its potential opportunities and threats. The method of SWOT analysis is to take the information from an environmental analysis and separate it into internal (strengths and weaknesses) and external issues (opportunities and threats). Once this is completed, SWOT analysis determines what may assist the firm in accomplishing its objectives, and what obstacles must be overcome or minimized to achieve desired results." [investopedia.com/ terms/ s/ swot.asp]
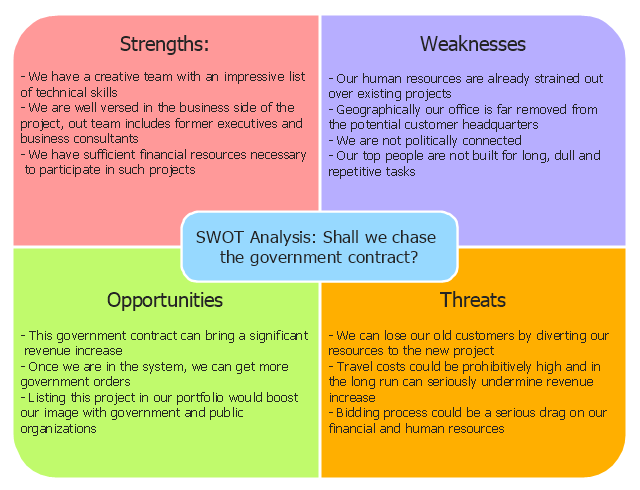
The SWOT matrix example "Government contract" was created using the ConceptDraw PRO diagramming and vector drawing software extended with the SWOT Analysis solution from the Management area of ConceptDraw Solution Park.
A tool that identifies the strengths, weaknesses, opportunities and threats of an organization. Specifically, SWOT is a basic, straightforward model that assesses what an organization can and cannot do as well as its potential opportunities and threats. The method of SWOT analysis is to take the information from an environmental analysis and separate it into internal (strengths and weaknesses) and external issues (opportunities and threats). Once this is completed, SWOT analysis determines what may assist the firm in accomplishing its objectives, and what obstacles must be overcome or minimized to achieve desired results." [investopedia.com/ terms/ s/ swot.asp]
The SWOT matrix example "Government contract" was created using the ConceptDraw PRO diagramming and vector drawing software extended with the SWOT Analysis solution from the Management area of ConceptDraw Solution Park.
SWOT
How to Make SWOT Analysis in a Word Document

This SWOT matrix diagram example was created on the base of article "An Easy Way To Jumpstart Your Strategic Plan: SWOT" by Leslie Wolf from the website of the California Digital Library, the University of California. "Strategic planning doesn’t have to be a daunting and lengthy process. The goal is really a simple one: to help you understand your world and build a road map to guide your efforts. ...
This analysis tool can help you focus your attention on the specific success factors that are right for your team.
The tool is called a SWOT analysis. SWOT stands for Strengths and Weaknesses, Opportunities and Threats. Here’s what it means:
(1) Strengths are those positive internal attributes that strengthen your business or team. You can develop plans to capitalize on those strengths.
(2) Weaknesses are those negative internal attributes that are working against your success. You can shore up those weaknesses so they don’t stop your success.
(3) Opportunities are those external conditions that can have a positive effect on your goals. These opportunities can point you in the right direction.
(4) Threats are those external conditions that can have a negative effect on your goals. These threats will affect you less if you can identify and minimize them. ...
We thought it would be helpful to show you a sample SWOT analysis for a business you can easily visualize: a small independent bookstore in a university town. The store owner brought the team together to think about how the bookstore could survive during the continuing financial downturn. After an hour of brainstorming, this is the SWOT analysis they developed." [cdlib.org/ cdlinfo/ 2010/ 09/ 29/ an-easy-way-to-jumpstart-your-strategic-plan-swot/ ]
The matrix diagram example "SWOT analysis for a small independent bookstore" was created using the ConceptDraw PRO diagramming and vector drawing software extended with the SWOT Analysis solution from the Management area of ConceptDraw Solution Park.
SWOT matrix

 Marketing
This solution extends ConceptDraw PRO v9 and ConceptDraw MINDMAP v7 with Marketing Diagrams and Mind Maps (brainstorming, preparing and holding meetings and presentations, sales calls).
 SYSML
SYSML
The SysML solution helps to present diagrams using Systems Modeling Language; a perfect tool for system engineering.
Flow chart Example. Warehouse Flowchart


IDEF1X Standard

 ConceptDraw Solution Park
ConceptDraw Solution Park collects graphic extensions, examples and learning materials
HelpDesk
How To Present a Business Process Model

How To Do A Mind Map In PowerPoint

 Rapid UML
Rapid UML solution extends ConceptDraw PRO software with templates, samples and libraries of vector stencils for quick drawing the UML diagrams using Rapid Draw technology.
HelpDesk
How to Create an IDEF0 Diagram for an Application Development

HelpDesk
Accounting Information Systems Flowchart Symbols

 Entity-Relationship Diagram (ERD)
Entity-Relationship Diagram (ERD) solution extends ConceptDraw PRO software with templates, samples and libraries of vector stencils from drawing the ER-diagrams by Chen's and crow’s foot notations.
- SWOT Analysis | Block diagram - Porter's five forces model | SWOT ...
- Swot Model
- SWOT analysis matrix diagram templates | SWOT Matrix Template ...
- Block diagram - Porter's five forces model | Matrices | Swot Analysis ...
- Porter's Value Chain | Block diagram - Porter's five forces model ...
- Block diagram - Porter's five forces model | Matrices | SWOT ...
- Block diagram - Porter's five forces model | Business Tools ...
- Block diagram - Porter's five forces model | SWOT analysis matrix ...
- Block diagram - Porter's five forces model | Business Processes ...
- SWOT analysis matrix diagram templates | Process Flowchart ...
- Porter's Value Chain | How to Make SWOT Analysis in a Word ...
- Swot Analysis Model
- Successful Strategic Plan | Software for Creating SWOT Analysis ...
- Swot Model Ppt
- SWOT Template | SWOT analysis matrix diagram templates | SWOT ...
- Pyramid Chart Examples | How to Make SWOT Analysis in a Word ...
- Successful Strategic Plan | SWOT analysis diagram - Template ...
- Matrix Model Diagram
- SWOT Analysis | Software for Creating SWOT Analysis Diagrams ...
- Block diagram - Six markets model