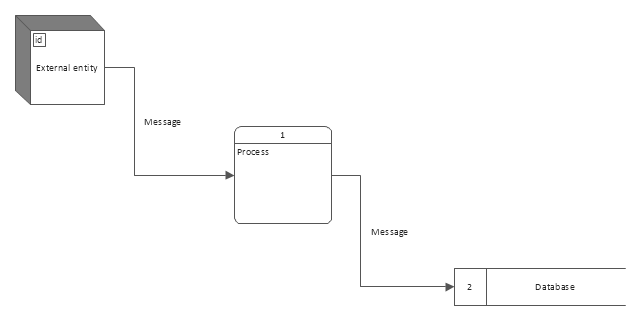
This site uses cookies. By continuing to browse the ConceptDraw site you are agreeing to our Use of Site Cookies.

Gane Sarson Diagram

The vector stencils library Gane-Sarson Notation from the solution Data Flow Diagrams contains specific symbols of the Gane-Sarson notation such as process symbol, connector symbol, jump symbol for ConceptDraw PRO diagramming and vector drawing software. The Data Flow Diagrams solution is contained in the Software Development area of ConceptDraw Solution Park.
Use this template to create your data flow diagrams (DFD) by Gane-Sarson (DFD) notation using the ConceptDraw PRO diagramming and vector drawing software extended with the Data Flow Diagrams solution from the Software Development area of ConceptDraw Solution Park.
DFD template
DFD template, process, external entity, data store,

Structured Systems Analysis and Design Method (SSADM) with ConceptDraw PRO

Structured Systems Analysis and Design Method SSADM is the method which is used at projecting and analysis of information systems. SSADM is based on the data flow diagrams. At the description of data flows out of the system and into the system DFD, which denote boundaries of the system, are used.

Example of DFD for Online Store (Data Flow Diagram) DFD Example

Data flow diagrams (DFDs) reveal relationships among and between the various components in a program or system. DFDs are an important technique for modeling a system’s high-level detail by showing how input data is transformed to output results through a sequence of functional transformations.
Example of DFD for Online Store shows the Data Flow Diagram for online store and interactions between the Visitors, Customers and Sellers, as well as Website Information and User databases.
Steps to Creating a Sales Process Flow Chart

Types of Flowcharts

A Flowchart is a graphically representation of the process, algorithm or the step-by-step solution of the problem. There are ten types of Flowcharts. Using the Flowcharts solution from the Diagrams area of ConceptDraw Solution Park you can easy and quickly design the Flowchart of any of these types.
How to Simplify Flow Charting

Data Flow Diagram Model

The DFD (Yourdon and Coad notation) example "Model of small traditional production enterprise" below was created using the ConceptDraw PRO diagramming and vector drawing software extended with the Data Flow Diagrams solution from the Software Development area of ConceptDraw Solution Park.

Yourdon and Coad Diagram

The vector stencils library Yourdon and Coad Notation from the solution OOAD contains specific symbols of the Yourdon and Coad notation such as data store symbol, data process symbol, loop symbol for ConceptDraw PRO diagramming and vector drawing software. The OOAD solution is contained in the Software Development area of ConceptDraw Solution Park.

Data Flow Diagrams

ConceptDraw PRO software enables you to quickly create data flow diagrams that include data storage, external entities, functional transforms, data flows, and control transforms and signals.

Data Flow Diagram Symbols. DFD Library

Data Flow Diagrams show information transfers and process steps of a system. The general concept is an approach of a depicting how occurs input in a system, further processes and what runs out. The aim of DFD is in accomplishing of understanding between developers and users. Data flow diagrams are maintained with other methods of structured systems analysis.

Data Modeling with Entity Relationship Diagram

Data modeling is actively applied in analysis and uses wide set of methods for description the data requirements in a system. One of the most popular and well-known is the ERD method of database modeling.
The best ERD tool for the Mac and Windows is ConceptDraw PRO software extended with the Entity-Relationship Diagram (ERD) solution from the Software Development Area for ConceptDraw Solution Park, which is sharpened for professional ERD drawing and data modeling with Entity Relationship Diagram.