Mechanical Drawing Symbols

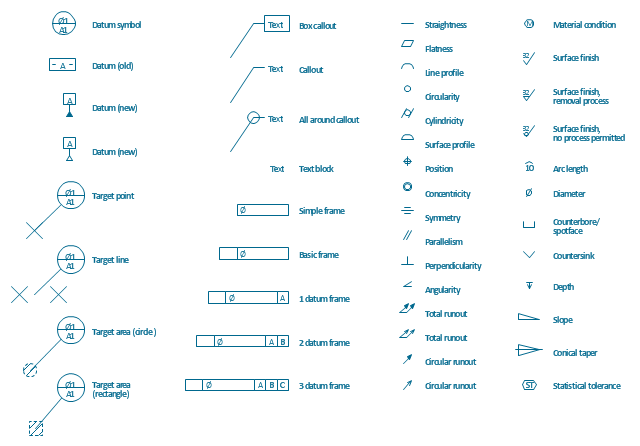
The vector stencils library "Dimensioning and tolerancing" contains 45 symbols of geometric dimensions and mechanical tolerances, geometric symbols, callouts, and text boxes and inserts.
Use these geometric dimensioning and tolerancing (GD&T) shapes to create annotated mechanical drawings.
"Geometric dimensioning and tolerancing (GD&T) is a system for defining and communicating engineering tolerances. It uses a symbolic language on engineering drawings and computer-generated three-dimensional solid models that explicitly describes nominal geometry and its allowable variation. It tells the manufacturing staff and machines what degree of accuracy and precision is needed on each controlled feature of the part. GD&T is used to define the nominal (theoretically perfect) geometry of parts and assemblies, to define the allowable variation in form and possible size of individual features, and to define the allowable variation between features." [Geometric dimensioning and tolerancing. Wikipedia]
The shapes example "Design elements - Dimensioning and tolerancing" was created using the ConceptDraw PRO diagramming and vector drawing software extended with the Mechanical Engineering solution from the ConceptDraw Solution Park.
Dimensioning and tolerancing symbols
Basic Flowchart Symbols and Meaning


The vector stencils library "Dimensioning and tolerancing" contains 45 symbols of geometric dimensions and mechanical tolerances, geometric symbols, callouts, and text boxes and inserts.
Use these geometric dimensioning and tolerancing (GD&T) shapes to create annotated mechanical drawings in the ConceptDraw PRO diagramming and vector drawing software extended with the Mechanical Engineering solution from the Engineering area of ConceptDraw Solution Park.
www.conceptdraw.com/ solution-park/ engineering-mechanical
Datum (old)
-dimensioning-and-tolerancing---vector-stencils-library.png--diagram-flowchart-example.png)
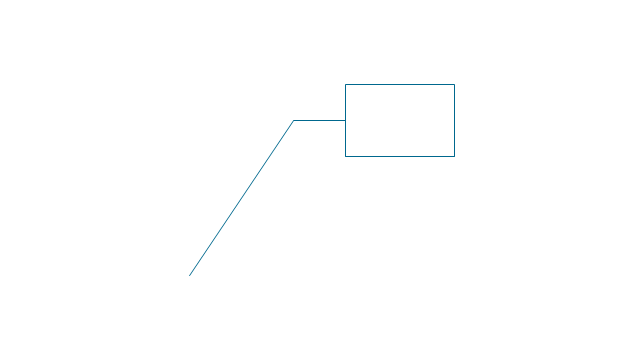
Box callout
Datum symbol
Callout

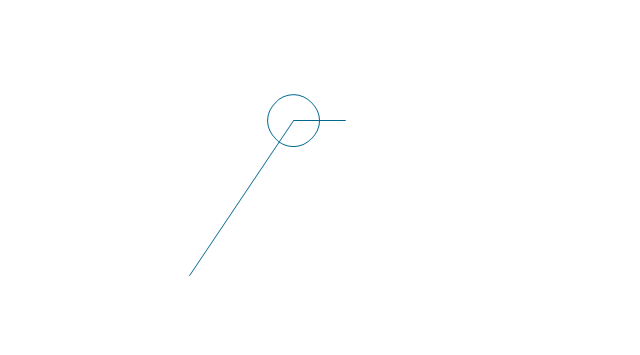
All around callout
Text block

2 datum frame
Simple frame

Basic frame

1 datum frame
3 datum frame
Straightness

Flatness

Line profile

Circularity

Cylindricity
Surface profile

Position

Concentricity

Symmetry
Parallelism

Perpendicularity
Angularity

Material condition

Arc length

Diameter

Counterbore/ spotface

Countersink

Depth
Slope
Conical taper
Statistical tolerance

Datum (new)
-dimensioning-and-tolerancing---vector-stencils-library.png--diagram-flowchart-example.png)
Datum (new) 2
-2-dimensioning-and-tolerancing---vector-stencils-library.png--diagram-flowchart-example.png)
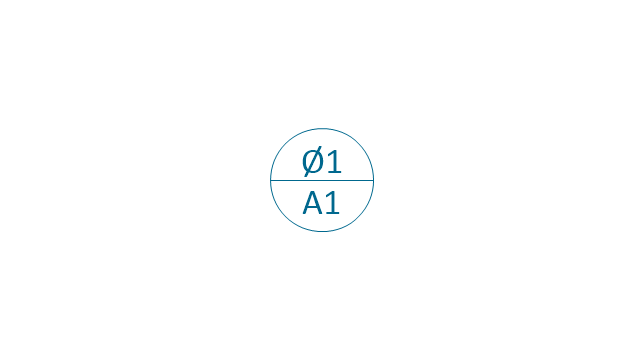
Target point
Target line
Target area (circle)
-dimensioning-and-tolerancing---vector-stencils-library.png--diagram-flowchart-example.png)
Target area (rectangle)
-dimensioning-and-tolerancing---vector-stencils-library.png--diagram-flowchart-example.png)
Total runout

Total runout 2
Circular runout
Circular runout 2

Surface finish

Surface finish, removal process

Surface finish, no process permitted

Scientific Symbols Chart

Mathematics Solution from the Science and Education area of ConceptDraw Solution Park includes a few shape libraries of plane, solid geometric figures, trigonometrical functions and greek letters to help you create different professional looking mathematic illustrations for science and education.
Mathematics Symbols

ERD Symbols and Meanings


HelpDesk
How to Create Flowchart Using Standard Flowchart Symbols

 Mechanical Engineering
This solution extends ConceptDraw PRO v.9 mechanical drawing software (or later) with samples of mechanical drawing symbols, templates and libraries of design elements, for help when drafting mechanical engineering drawings, or parts, assembly, pneumatic,
Mathematical Diagrams

Audit Flowchart Symbols

HelpDesk
How to Draw Geometric Shapes in ConceptDraw PRO

ConceptDraw PRO: Able to Leap Tall Buildings in a Single Bound

Spatial Data Analysis

Sales Process Flowchart Symbols

- Mechanical Drawing Symbols | Design elements - Dimensioning ...
- Mechanical Drawing Symbols | Mechanical Engineering ...
- Scientific Symbols Chart | Mathematics Symbols | Mechanical ...
- Mechanical Drawing Symbols | Mechanical Engineering ...
- Mechanical Design Symbols Used In Parts Design
- Mechanical Drawing Symbols | Mechanical Drawing Software ...
- Mechanical Drawing Symbols | Design elements - Dimensioning ...
- Mechanical Drawing Symbols | Mechanical Engineering | Technical ...
- Mechanical Drawing Symbols | Basic Flowchart Symbols and ...
- Mechanical Drawing Symbols | Design elements - Dimensioning ...
- Mechanical Drawing Symbols | Mechanical Engineering ...
- How to Draw Geometric Shapes in ConceptDraw PRO | Mechanical ...
- Symbols Used In Engg Drawing For Various Geometrical Figures
- Mechanical Drawing Symbols | Mechanical Engineering | Design ...
- Mechanical Drawing Symbols | Mechanical Engineering ...
- Mechanical Drawing Symbols | Mechanical Engineering | Design ...
- Mechanical Engineering Symbol Use In Drawing
- Mechanical Drawing Symbols | Technical Drawing Software ...
- Mechanical Drawing Symbols | Electrical Symbols , Electrical ...
- Which Symbol Generally Used In Mechanical Drawing