Mathematics Symbols

 Mathematics
Mathematics solution extends ConceptDraw PRO software with templates, samples and libraries of vector stencils for drawing the mathematical illustrations, diagrams and charts.
Bar Diagram Math

Basic Diagramming


Mathematical Diagrams

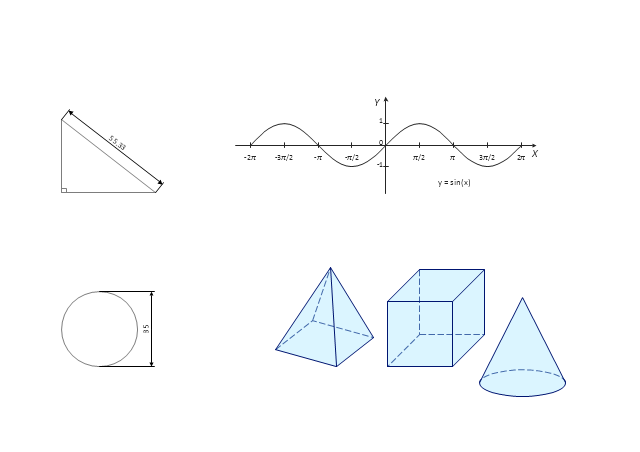
Use this mathematical drawings and graphs template to create your own math illustrations using the shapes of plane and solid geometric figures as well as trigonometric functions.
"Mathematical visualization or mathematical visualization is an aspect of geometry which allows one to understand and explore mathematical phenomena via visualization. Classically this consisted of two-dimensional drawings or building three-dimensional models (particularly plaster models in the 19th and early 20th century), while today it most frequently consists of using computers to make static two or three dimensional drawings, animations, or interactive programs. Writing programs to visualize mathematics is an aspect of computational geometry." [Mathematical visualization. Wikipedia]
The math illustrations template for the ConceptDraw PRO diagramming and vector drawing software is included in the Mathematics solution from the Science and Education area of ConceptDraw Solution Park.
Mathematical drawings and graphs
HelpDesk
How to Draw Geometric Shapes in ConceptDraw PRO

"In mathematics, the Euclidean algorithm, or Euclid's algorithm, is a method for computing the greatest common divisor (GCD) of two (usually positive) integers, also known as the greatest common factor (GCF) or highest common factor (HCF). ...
The GCD of two positive integers is the largest integer that divides both of them without leaving a remainder (the GCD of two integers in general is defined in a more subtle way).
In its simplest form, Euclid's algorithm starts with a pair of positive integers, and forms a new pair that consists of the smaller number and the difference between the larger and smaller numbers. The process repeats until the numbers in the pair are equal. That number then is the greatest common divisor of the original pair of integers.
The main principle is that the GCD does not change if the smaller number is subtracted from the larger number. ... Since the larger of the two numbers is reduced, repeating this process gives successively smaller numbers, so this repetition will necessarily stop sooner or later - when the numbers are equal (if the process is attempted once more, one of the numbers will become 0)." [Euclidean algorithm. Wikipedia]
The flowchart example "Euclidean algorithm" was created using the ConceptDraw PRO diagramming and vector drawing software extended with the Mathematics solution from the Science and Education area of ConceptDraw Solution Park.
Euclid's algorithm flow chart

Physics Diagrams

Venn Diagram

"In elementary algebra, a quadratic equation (from the Latin quadratus for "square") is any equation having the form
ax^2+bx+c=0
where x represents an unknown, and a, b, and c are constants with a not equal to 0. If a = 0, then the equation is linear, not quadratic. The constants a, b, and c are called, respectively, the quadratic coefficient, the linear coefficient and the constant or free term.
Because the quadratic equation involves only one unknown, it is called "univariate". The quadratic equation only contains powers of x that are non-negative integers, and therefore it is a polynomial equation, and in particular it is a second degree polynomial equation since the greatest power is two.
Quadratic equations can be solved by a process known in American English as factoring and in other varieties of English as factorising, by completing the square, by using the quadratic formula, or by graphing." [Quadratic equation. Wikipedia]
The flowchart example "Solving quadratic equation algorithm" was created using the ConceptDraw PRO diagramming and vector drawing software extended with the Mathematics solution from the Science and Education area of ConceptDraw Solution Park.
Solving quadratic equation flow chart

Scientific Symbols Chart

Mathematics Solution from the Science and Education area of ConceptDraw Solution Park includes a few shape libraries of plane, solid geometric figures, trigonometrical functions and greek letters to help you create different professional looking mathematic illustrations for science and education.
Venn Diagram Template for Word

Circles Venn Diagram

 Education
This solution extends ConceptDraw PRO and ConceptDraw MINDMAP with specific content that helps illustrate educational documents, presentations, and websites quickly and easily with astronomy, chemistry, math and physics vector pictures and clip art.
- Mathematics Symbols | Mathematical Diagrams | Scientific Symbols ...
- Other Charts Of Maths Of Drawn Picture Of Mathematician
- Concept Mapping For Maths
- Physics Diagrams | Physics Symbols | Mathematics Symbols | Maths ...
- Euclidean algorithm - Flowchart | Mathematics | Maths Vs Computer ...
- Bar Diagram Math | Pie Charts | ConceptDraw Solution Park | Maths ...
- Basic Diagramming | Mathematical Diagrams | Mathematics ...
- Maths VS Computer Flowchart
- Conservation Of Natural Resources Pie Chart Maths
- Basic Diagramming | Mathematics Symbols | Mathematical ...
- Process Flowchart | Illustration Skill With Example In Maths
- Math Topics Flow Chart Examples
- Basic Diagramming | Mathematics | How to Draw Geometric Shapes ...
- Maths Project Diagram
- Mathematical Diagrams | Basic Diagramming | Mathematics ...
- Venn Diagram Representation Of Maths Sciences And Biology
- Mind Maps Related To Maths Formulae And Concepts
- Science Maths Biology Venn Diagram
- Nutrition Bar Graph And Pie Chart In Maths
- How to Create a Pyramid Diagram | Bar Diagram Math | Pyramid ...