 Logistics Flow Charts
Logistics Flow Charts solution extends ConceptDraw PRO v11 functionality with opportunities of powerful logistics management software. It provides large collection of predesigned vector logistic symbols, pictograms, objects and clipart to help you design with pleasure Logistics flow chart, Logistics process flow diagram, Inventory flow chart, Warehouse flowchart, Warehouse management flow chart, Inventory control flowchart, or any other Logistics diagram. Use this solution for logistics planning, to reflect logistics activities and processes of an enterprise or firm, to depict the company's supply chains, to demonstrate the ways of enhancing the economic stability on the market, to realize logistics reforms and effective products' promotion.
Process Flowchart


 Total Quality Management TQM Diagrams
Total Quality Management Diagrams solution extends ConceptDraw PRO software with samples, templates and vector stencils library for drawing the TQM flowcharts.
 Logistic Dashboard
The powerful tools of Logistic Dashboard solution and specially developed live graphic objects of logistic icons, logistic navigation elements, logistic indicators, logistic charts and logistic maps effectively assist in designing Logistic dashboards, Logistic maps, Logistic charts, diagrams and infographics. The included set of prebuilt samples and quick-start templates, demonstrates the power of ConceptDraw PRO software in logistics management, its assisting abilities in development, realization and analyzing the logistic processes, as well as in perfection the methods of logistics management.
HelpDesk
How to Make a Logistics Flow Chart

 ConceptDraw Solution Park
ConceptDraw Solution Park collects graphic extensions, examples and learning materials
Flow chart Example. Warehouse Flowchart


Bar Diagrams for Problem Solving. Create event management bar charts with Bar Graphs Solution

Business Process Modeling

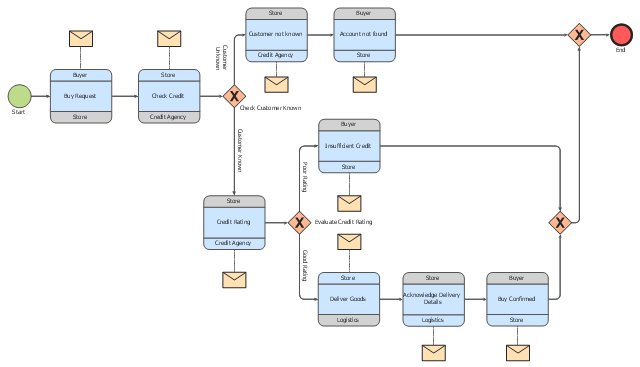
This choreography BPMN (Business Process Model and Notation) diagram sample shows the logistics workflow.
"Logistics is the management of the flow of goods between the point of origin and the point of consumption in order to meet some requirements, for example, of customers or corporations. The resources managed in logistics can include physical items, such as food, materials, animals, equipment and liquids, as well as abstract items, such as time, information, particles, and energy. The logistics of physical items usually involves the integration of information flow, material handling, production, packaging, inventory, transportation, warehousing, and often security. The complexity of logistics can be modeled, analyzed, visualized, and optimized by dedicated simulation software. The minimization of the use of resources is a common motivation in logistics for import and export." [Logistics. Wikipedia]
The business process modeling diagram example "Logistics - Choreography BPMN 2.0 diagram" was designed using the ConceptDraw PRO diagramming and vector drawing software extended with the Business Process Diagram solution from the Business Processes area of ConceptDraw Solution Park.
Business process modeling
 Event-driven Process Chain Diagrams
Event-driven Process Chain (EPC) Diagram is a type of flowchart widely used for modeling in business engineering and reengineering, business process improvement, and analysis. EPC method was developed within the Architecture of Integrated Information Systems (ARIS) framework.
 Fishbone Diagrams
The Fishbone Diagrams solution extends ConceptDraw PRO v10 software with the ability to easily draw the Fishbone Diagrams (Ishikawa Diagrams) to clearly see the cause and effect analysis and also problem solving. The vector graphic diagrams produced using this solution can be used in whitepapers, presentations, datasheets, posters, and published technical material.
 Stakeholder Onion Diagrams
The Stakeholder Onion Diagram is often used as a way to view the relationships of stakeholders to a project goal. A basic Onion Diagram contains a rich information. It shows significance of stakeholders that will have has influence to the success achieve
- Diagram Of Logistics Management
- Logistics Management Flow Chart And Details
- Process Flowchart | How to Make a Logistics Flow Chart | Total ...
- Process Flowchart | Total Quality Management Definition | Logistics ...
- Logistics Management Diagram
- Process Flowchart | Logistics Flow Charts | How to Make a Logistics ...
- Process Flowchart | Total Quality Management Definition | How to ...
- Supply Chain Management Flow Diagram
- Logistic Management Flow Chart In Our Organization
- Process Flowchart | Logistics Flow Charts | Types of Flowcharts ...
- Logistic Management Flow Chart
- Basic Flowchart Symbols and Meaning | Logistics Flow Charts | UML ...
- Process Flowchart | Total Quality Management Definition | Cross ...
- Basic Flowchart Symbols and Meaning | Event-driven Process ...
- Total Quality Management with ConceptDraw | Block Diagrams ...
- Pyramid Diagram | Feature Comparison Chart Software | Logistics ...
- Strategic Management Diagram
- Flow chart Example. Warehouse Flowchart | Basic Flowchart ...
- Flow chart Example. Warehouse Flowchart | Basic Flowchart ...
- Logistics Flow Charts | Logistic Dashboard | Process Flowchart ...