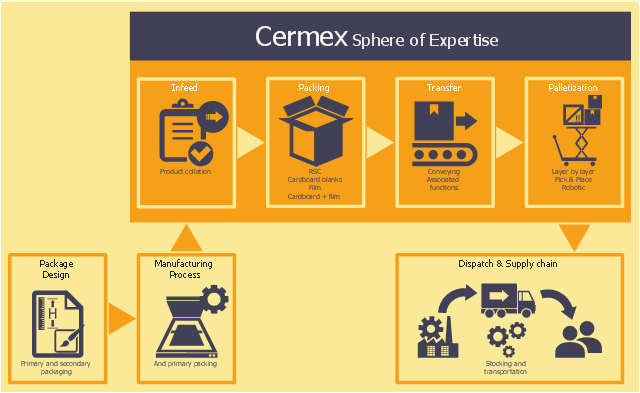
This logistic flow chart sample shows the Cermex sphere of expertise.
It was designed on the base of the Wikimedia Commons file: End of Line drawing.jpg.
[commons.wikimedia.org/ wiki/ File:End_ of_ Line_ drawing.jpg]
This file is licensed under the Creative Commons Attribution-Share Alike 3.0 Unported license. [creativecommons.org/ licenses/ by-sa/ 3.0/ deed.en]
"Cermex is a company that manufactures case packing, shrink-wrapping and palletizing machinery. Cermex supplies engineering and equipment to automate end of line packaging, from the packed product to the loaded pallet. Cermex supports global engineering and equipment for the packaging of various and diverse products, from individual product packaging to completing finished pallets for shipment." [Cermex. Wikipedia]
The logistic flowchart example "End of Line drawing" was created using ConceptDraw PRO diagramming and vector drawing software extended with the Logistics Flow Charts solution from the Business Processes area of ConceptDraw Solution Park.
Logistic flowchart
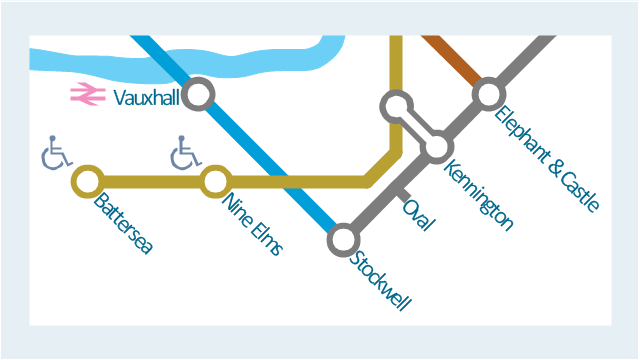
This spatial infographic example was created on the base of the tube map from the Transport for London website.
[tfl.gov.uk/ assets/ images/ general/ 24746-nle-gallery-tube-map.jpg]
"The Tube map is a schematic transit map of the lines and stations of London's public rapid transit railway systems, namely the London Underground (commonly known as the Tube, hence the name), Docklands Light Railway, London Overground and Emirates Air Line, as well as being incorporated into Greater London connections maps.
As a schematic diagram, it shows not necessarily the geographic but rather the relative positions of stations along the lines, stations' connective relations with each other and fare zones. The basic design concepts have been widely adopted for other network maps around the world, especially that of mapping topologically rather than geographically." [Tube map. Wikipedia]
The spatial infographics example "Metro map - Northern line extension to Battersea via Nine Elms" was created using the ConceptDraw PRO diagramming and vector drawing software extended with the Spatial Infographics solution from the area "What is Infographics" of ConceptDraw Solution Park.
Tube map
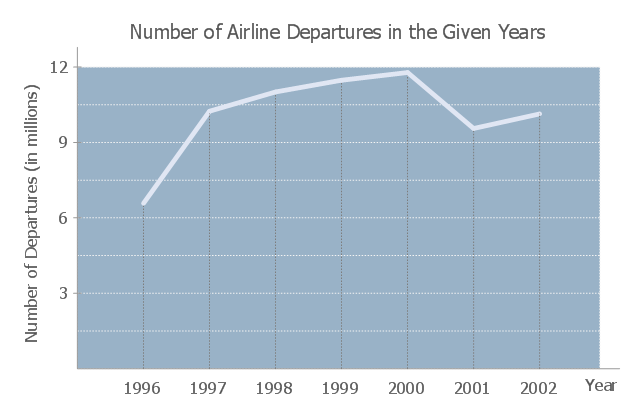
This line graph sample shows the number of airlines departures in 1996-2002. It was designed on the base of the Wikimedia Commons file: -6 time series.JPG
[commons.wikimedia.org/ wiki/ File:-6_ time_ series.JPG].
"The social science of economics makes extensive use graphs to better illustrate the economic principles and trends it is attempting to explain. Those graphs have specific qualities that are not often found (or are not often found in such combinations) in other sciences. ...
More generally, there is usually some mathematical model underlying any given economic graph. For instance, the commonly used supply-and-demand graph has its underpinnings in general price theory — a highly mathematical discipline." [Economic graph. Wikipedia]
The line chart example "Number of airlines departures in the given years" was designed using the ConceptDraw PRO diagramming and vector drawing software extended with the Line Graphs solution from the Graphs and Charts area of ConceptDraw Solution Park.
Line chart
 Line Graphs
How to draw a Line Graph with ease? The Line Graphs solution extends the capabilities of ConceptDraw PRO v10 with professionally designed templates, samples, and a library of vector stencils for drawing perfect Line Graphs.
Export from ConceptDraw PRO Document to a Graphic File


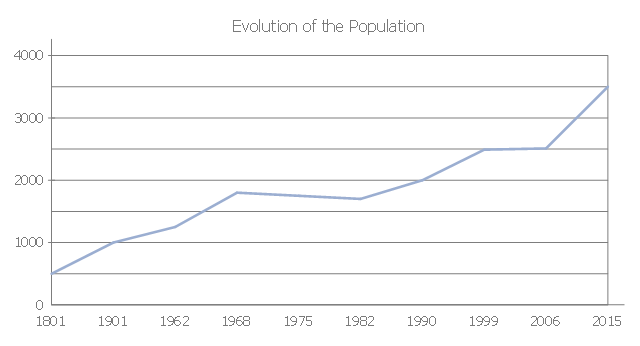
This line graph sample shows evolution of the population from 1801 till nowadays. It was designed on the base of the Wikimedia Commons file:
Evolution de la population vertoise 1801 maintenant.JPG
[commons.wikimedia.org/ wiki/ File:Evolution_ de_ la_ population_ vertoise_ 1801_ maintenant.JPG].
"Evolution is the change in the inherited characteristics of biological populations over successive generations. Evolutionary processes give rise to diversity at every level of biological organisation, including species, individual organisms and molecules such as DNA and proteins.
All life on Earth is descended from a last universal ancestor that lived approximately 3.8 billion years ago. Repeated speciation and the divergence of life can be inferred from shared sets of biochemical and morphological traits, or by shared DNA sequences. These homologous traits and sequences are more similar among species that share a more recent common ancestor, and can be used to reconstruct evolutionary histories, using both existing species and the fossil record. Existing patterns of biodiversity have been shaped both by speciation and by extinction." [Evolution. Wikipedia]
The line chart example "Evolution of the population" was created using the ConceptDraw PRO diagramming and vector drawing software extended with the Basic Line Graphs solution from the Graphs and Charts area of ConceptDraw Solution Park.
Line chart
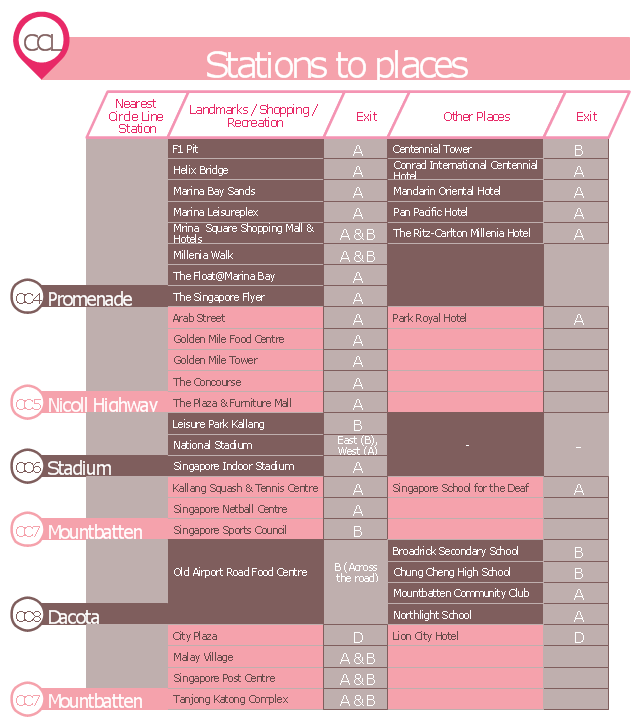
This typography infographics example was redesigned from the Wikimedia Commons file: CCLStationstoplaces.jpg. [commons.wikimedia.org/ wiki/ File:CCLStationstoplaces.jpg]
This file is licensed under the Creative Commons Attribution-Share Alike 3.0 Unported license. [creativecommons.org/ licenses/ by-sa/ 3.0/ deed.en]
"The Circle Line (CCL) is Singapore's fourth Mass Rapid Transit line. This underground line is 35.7 kilometres (22.2 mi) long with 31 stations (excluding Bukit Brown) and is fully automatically operated. It takes about one hour to travel from one end to the other. The line is coloured orange in the rail map.
As the name implies, the line is an orbital circle route linking all radial routes leading to the city. It also covers many parts of the Central Area. From Promenade, the line branches with one branch terminating at Dhoby Ghaut and the other terminating at Marina Bay. Transfers to the North South Line are provided at Bishan, Dhoby Ghaut and Marina Bay, East West Line at Paya Lebar and Buona Vista, and North East Line at Dhoby Ghaut, Serangoon and HarbourFront. The Downtown Line interchanges with the Circle Line at Bayfront and Promenade and future sections of the Downtown Line will interchange at Botanic Gardens and MacPherson. The future Thomson Line will interchange with the Circle Line at Caldecott and Marina Bay.
The Circle Line is the first medium capacity line in Singapore. As a medium capacity line, each Circle Line train has only three cars instead of the six-car configuration as seen on current MRT lines. Half a million people are expected to use the Circle Line each day. The line reduces travelling time for commuters by allowing them to shorten trips between north to east or north to west and vice versa, bypassing busy interchange like City Hall and Raffles Place." [Circle MRT Line. Wikipedia]
The example "CCL Stations to places - Infographics" was created using the ConceptDraw PRO diagramming and vector drawing software extended with the Typography Infographics solition from the area "What is infographics" in ConceptDraw Solution Park.
Infographics
UML Class Diagram Notation

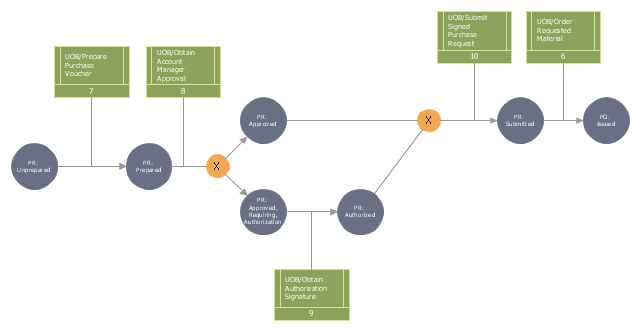
This IDEF3 diagram example was redesigned from the Wikimedia Commons file: 2-02 Example of a Transition Schematic.jpg.
[commons.wikimedia.org/ wiki/ File:2-02_ Example_ of_ a_ Transition_ Schematic.jpg]
"The schematic in Figure 2-2 represents an Object Schematic for the Order Material scenario derived from the business owner’s description. This example happens to illustrate a Transition Schematic since it characterizes the nature and structure of object state transitions for occurrences of the Order Material scenario. A key document in this process is the Purchase Request form. This form is eventually transformed into a Purchase Order (PO) via the Order Material process. A circle containing the name of an object represents an object of a certain kind (e.g., Purchase Request, Account Manager, Project). These labeled circles are known as kind symbols. A certain kind of object being in a certain state is represented by a circle with a label that captures both the kind itself and a corresponding state, thereby representing the type (or class) of objects that are in that state (within a given process). ... One of the first steps to develop an Object Schematic is to identify the possible states in which the object can exist. Though a real-world object often evolves through a continuum of states, an Object Schematic focuses on those distinguished states of particular interest to the domain expert. The transition arcs (arrows with triangular, filled-in heads) connecting the circles symbolize a state transition, the activity of changing from one state to another. The conditions that establish when an object is in a given state, how it exists a state, how it can transition between states, and how it can enter a new state are recorded on a special form. The banded boxes linked to the arrows (called referents) are aids to describe the relationships between objects states and UOBs, scenarios, or other Transition Schematics that participate in a scenario occurrence. ... The transition junctions containing an “X” (for exclusive or) indicate the choice of exactly one path among several possible paths in an occurrence." [IDEF3 Process Description Capture Method Report AL-TR-1995-XXXX. idef.com/ pdf/ Idef3_ fn.pdf]
The diagram "Transition schematic - IDEF3 diagram example" was created using the ConceptDraw PRO diagramming and vector drawing software extended with the solution "IDEF Business Process Diagrams" from the area "Business Processes" of ConceptDraw Solution Park.
IDEF3 business process diagram
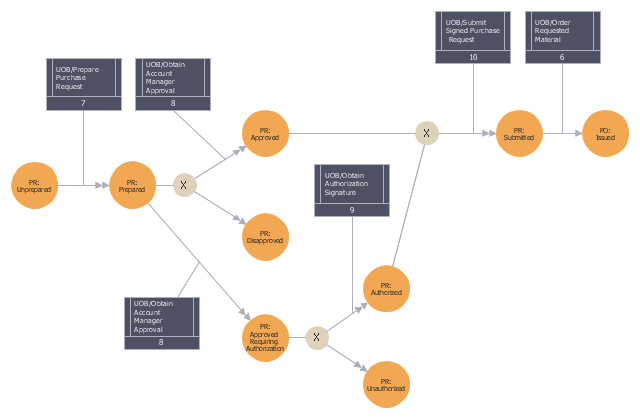
This IDEF3 diagram example was redesigned from the Wikimedia Commons file: 5-21 Completed Transition Schematic.jpg.
[commons.wikimedia.org/ wiki/ File:5-21_ Completed_ Transition_ Schematic.jpg]
"As with the Process Schematic, the correctness of the Object Schematic and
associated elaborations are confirmed through validation with the domain expert. After reviewing the Transition Schematic, the domain expert observes that the allowable state transitions displayed in the schematic do not include those representative of a failed request. ...
The domain expert also identified transitions through which the identity of the object was preserved and transitions where the object was actually transformed into an entirely different object. The domain expert’s comments to the analyst yield the schematic
depicted in Figure 5-21." [IDEF3 Process Description Capture Method Report AL-TR-1995-XXXX. idef.com/ pdf/ Idef3_ fn.pdf]
The sample "Completed transition schematic - IDEF3 diagram" was created using the ConceptDraw PRO diagramming and vector drawing software extended with the solution "IDEF Business Process Diagrams" from the area "Business Processes" of ConceptDraw Solution Park.
IDEF3 business process diagram
- Number of airlines departures in the given years - Line chart ...
- High level fault tree | Plumbing and Piping Plans | Line Graphs ...
- Line chart - Evolution of the population | Line Chart Examples | Chart ...
- Leased Line Network Diagram
- Evolution of the population | Divergence Line Graph
- Line Graphs | High level fault tree | Package Diagram For Hospital
- Number of airlines departures in the given years - Line chart | Line ...
- Line Chart Examples | Chart Examples | Picture Graph | Graph ...
- Line Graphs | How to Draw a Line Chart Quickly | How to Create a ...
- Line chart - Number of airlines departures in the given years | Line ...