This site uses cookies. By continuing to browse the ConceptDraw site you are agreeing to our Use of Site Cookies.

Data Flow Diagram Symbols. DFD Library

Data Flow Diagrams show information transfers and process steps of a system. The general concept is an approach of a depicting how occurs input in a system, further processes and what runs out. The aim of DFD is in accomplishing of understanding between developers and users. Data flow diagrams are maintained with other methods of structured systems analysis.

Entity Relationship Diagram Examples

ConceptDraw DIAGRAM diagramming and vector drawing software offers the Entity-Relationship Diagram (ERD) Solution from the Software Development Area for ConceptDraw Solution Park. How many examples contains the Entity-Relationship Diagram (ERD) Solution! All Entity Relationship Diagram examples were designed and saved for ConceptDraw DIAGRAM users. Now they are available from ConceptDraw STORE.

Data Flow Diagram (DFD)

This example is created using ConceptDraw DIAGRAM enhanced with solution Data Flow Diagrams. This diagram shows one of the business processes to simplify and accelerate understanding, analysis, and representation.

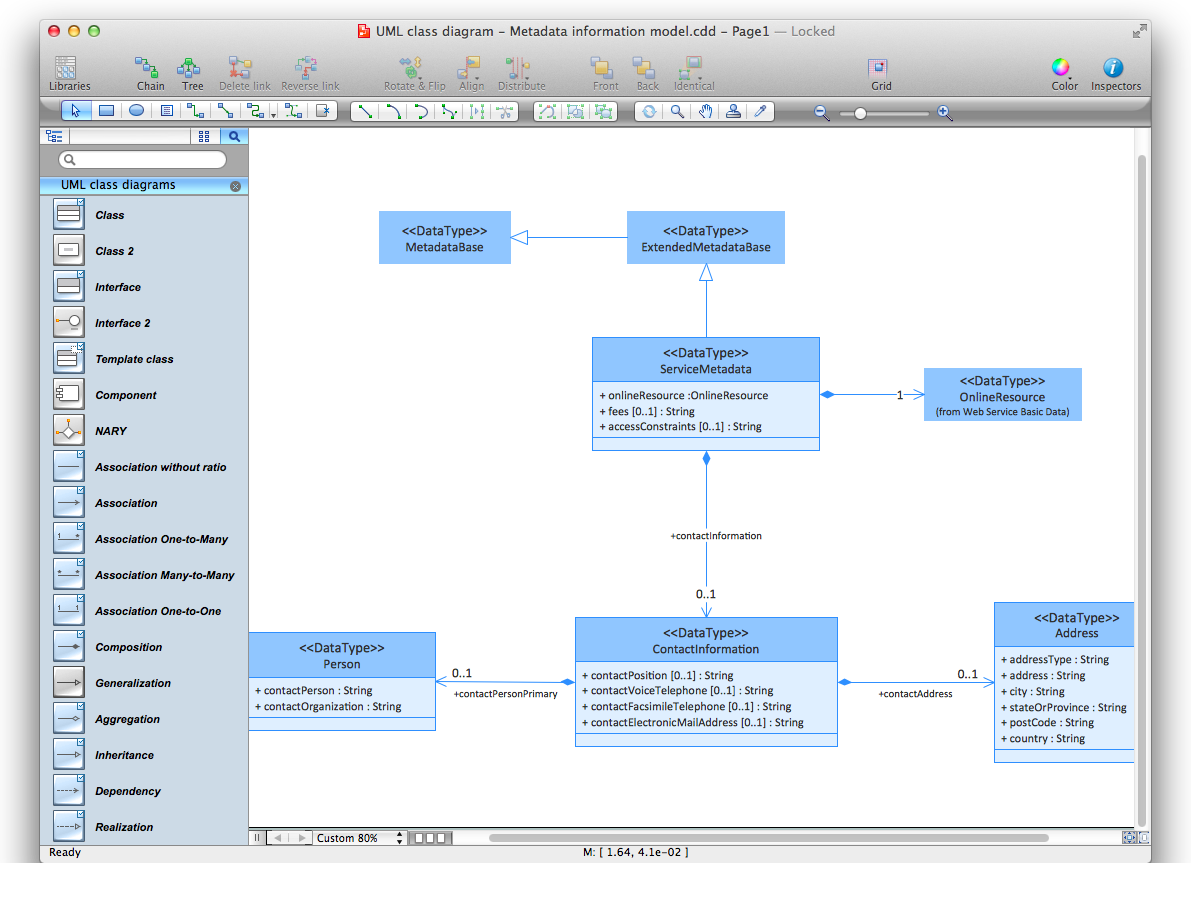
UML Class Diagrams. Diagramming Software for Design UML Diagrams

In software engineering, a UML Class Diagrams is a type of static structure diagram that is used both for general conceptual modeling of the systematics of the application, and for detailed modeling translating the models into programming code.
Use ConceptDraw DIAGRAM with UML class diagram templates, samples and stencil library from Rapid UML solution to show the classes of system, their attributes, operations or methods, and the relationships among the classes.

DFD Library System

Use the Data Flow Diagrams solution from the Software Development area of ConceptDraw Solution Park to draw your own context-level DFDs using the ConceptDraw DIAGRAM diagramming and vector drawing software.

Bubble diagrams in Landscape Design with ConceptDraw DIAGRAM

To define the links between the different areas of your own landscape design and see the project from aside, we recommend to draw landscape diagram called bubble one which is analogue of «mind maps» as it allows us to create approximate image of our future proper landscape view. Use special libraries (and we have plenty of them) with objects of landscape design to be able to create the detailed plan of your landscape which will be looking so smart and professionally good as the samples we provide were created by designers who know so much about making such kinds of design plans. Having ConceptDraw DIAGRAM as the assistant in your work, will ensure the success after using our product. Make the bubble diagrams as well as any other ones in minutes with ease having our application called ConceptDraw DIAGRAM and you will see how quick it will change your life simplifying lots of work.

chemical engineering, process engineering, process flow diagram symbols, process and instrumentation diagram, process diagrams Chemical and Process Engineering

chemical engineering, process engineering, process flow diagram symbols, process and instrumentation diagram, process diagrams
This chemical engineering solution extends ConceptDraw DIAGRAM.9.5 (or later) with process flow diagram symbols, samples, process diagrams templates and libraries of design elements for creating process and instrumentation diagrams, block flow diagrams (BFD

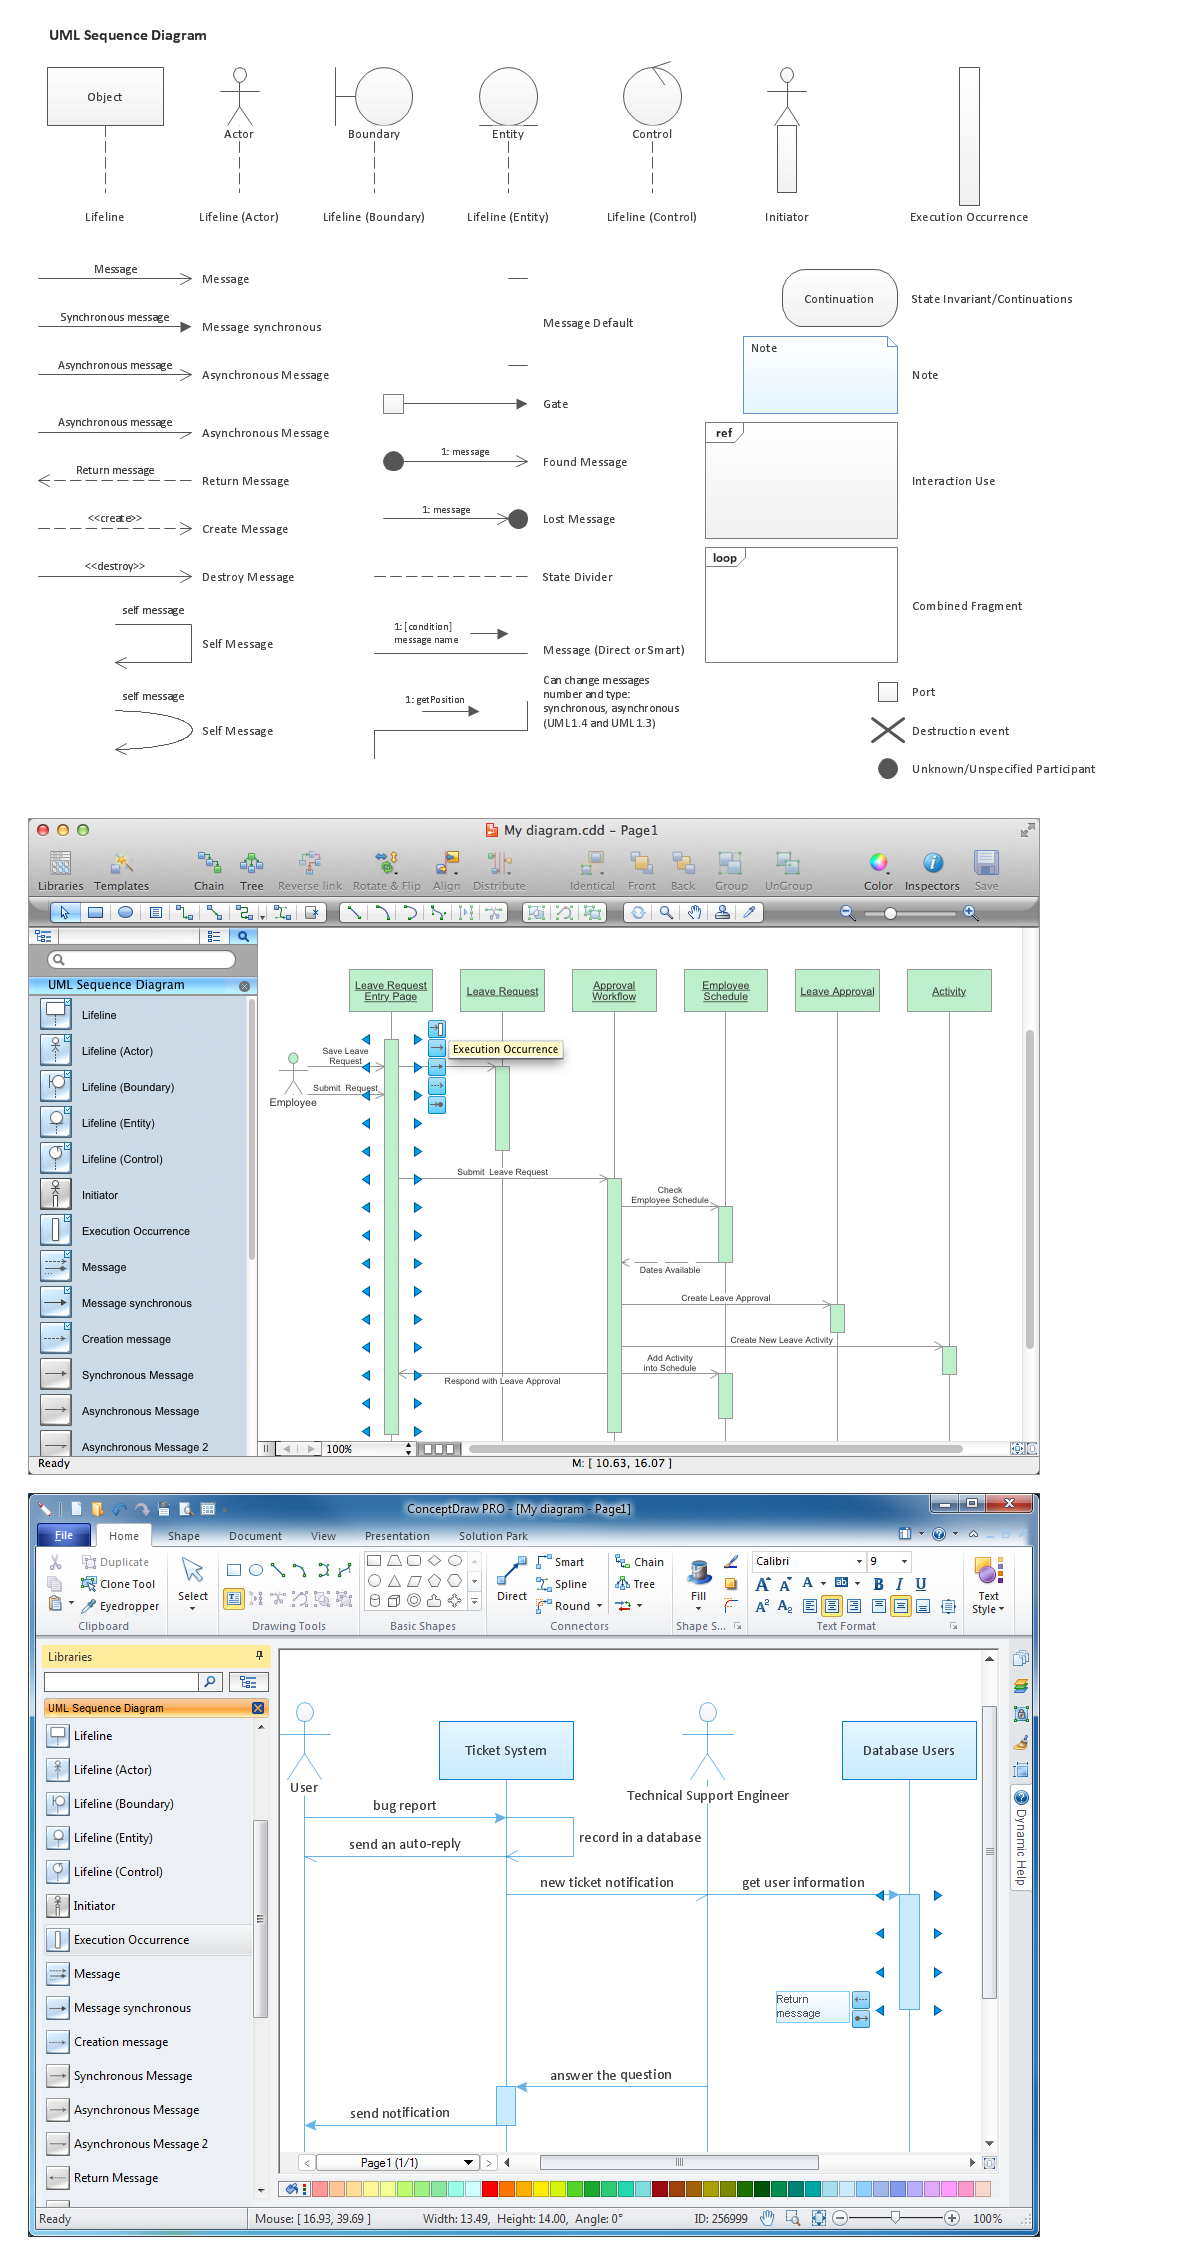
Diagramming Software for designing UML Sequence Diagrams

Sequence Diagrams shows how objects communicate with each other in terms of a sequence of messages. Also indicates the lifespans of objects relative to those messages.

Context Diagram Template

This template shows the Context Diagram. It was created in ConceptDraw DIAGRAM diagramming and vector drawing software using the Block Diagrams Solution from the “Diagrams” area of ConceptDraw Solution Park.
The context diagram graphically identifies the system. external factors, and relations between them. It’s a high level view of the system. The context diagrams are widely used in software engineering and systems engineering for designing the systems that process the information.

Developing Entity Relationship Diagrams

When you need to visually represent the structure of relational database, Entity relationship diagram (ERD) is a type of diagram for that case.
Most entity-relationship diagrams can be built with objects from Flowchart solution or ERD Solution which contains inbuilt templates. Follow these steps to create your own custom ERD diagram.
Don't be frightened if it looks complex, ConceptDraw DIAGRAM makes it easy to create an ERD, and hundreds of other diagrams, in minutes.