This site uses cookies. By continuing to browse the ConceptDraw site you are agreeing to our Use of Site Cookies.

State Diagram Example — Online Store

This sample was created in ConceptDraw DIAGRAM diagramming and vector drawing software using the UML State Mashine Diagram library of the Rapid UML Solution from the Software Development area of ConceptDraw Solution Park. This sample shows the work of the online store and can be used for the understanding of the online shopping processes, for projection and creating of the online store.

SysML

Systems Modeling Language (SysML) is a general-purpose modeling language for systems engineering applications. ConceptDraw DIAGRAM diagramming and vector drawing software was extended with SysML Solution from the Software Development Area of ConceptDraw Solution Park specially to help systems engineers design various model systems with SysML.

atm solutions,uml examples, uml example, uml diagram creator, best uml tool, banking system ATM UML Diagrams

atm solutions,uml examples, uml example, uml diagram creator, best uml tool, banking system
The ATM UML Diagrams solution lets you create ATM solutions and UML examples. Use ConceptDraw DIAGRAM as a UML diagram creator to visualize a banking system.
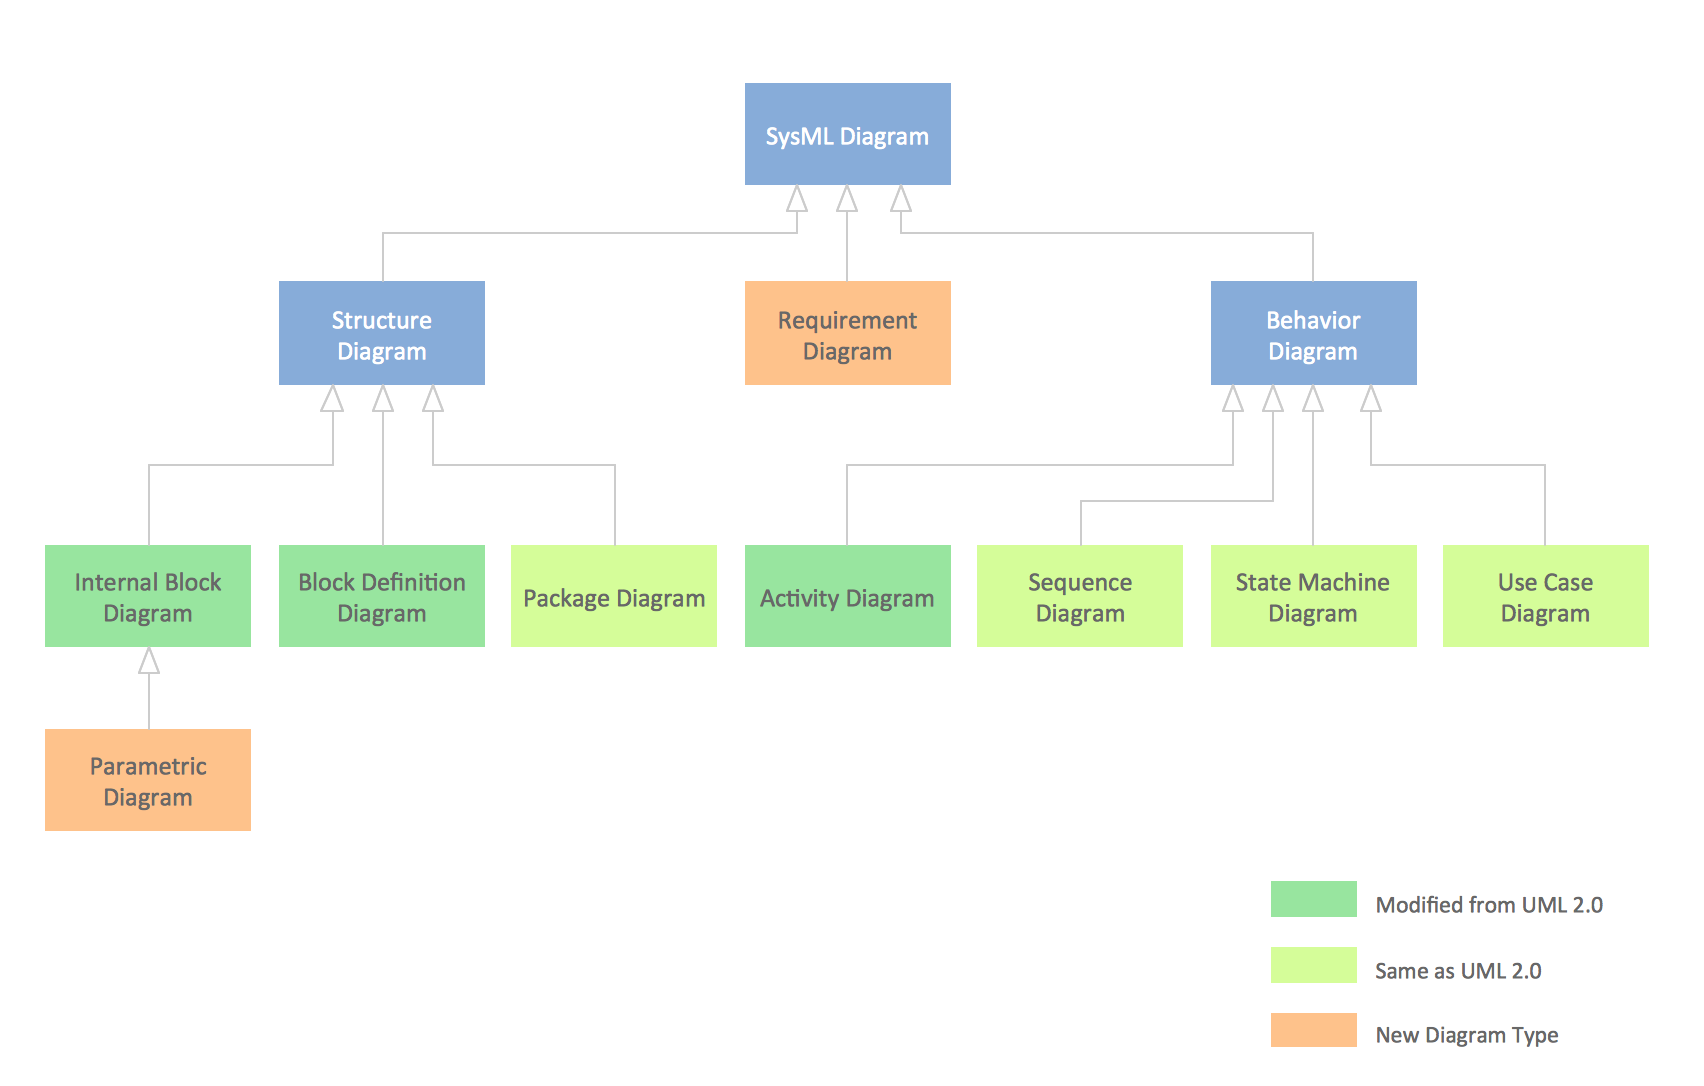
SysML Diagram

To draw SysML diagrams use the ConceptDraw DIAGRAM diagramming and vector drawing software extended with the Rapid UML solution from the Software Development area of ConceptDraw Solution Park.

systems engineering, sysml SYSML

systems engineering, sysml
The SysML solution helps to present diagrams using Systems Modeling Language; a perfect tool for system engineering.

Booch OOD Diagram

The vector stencils library Booch OOD from the solution Software Engineering contains specific symbols of the Booch method such as class symbols, association symbols, aggregation symbols for ConceptDraw DIAGRAM diagramming and vector drawing software. The Software Engineering solution is contained in the Software Development area of ConceptDraw Solution Park.

Data structure diagram with ConceptDraw DIAGRAM

Data structure diagram (DSD) is intended for description of conceptual models of data (concepts and connections between them) in the graphic format for more obviousness. Data structure diagram includes entities description, connections between them and obligatory conditions and requirements which connect them. Create Data structure diagram with ConceptDraw DIAGRAM.

UML Business Process

UML diagrams of business processes. The Rapid UML solution provides diagram examples, templates and vector stencils libraries for quick and easy drawing all types of UML 2.x and 1.x diagrams: UML activity diagrams, UML communication (collaboration) diagrams, UML component diagrams, UML composite structure diagrams, UML deployment diagrams, UML interaction overview diagrams, UML object diagrams, UML package diagrams, UML sequence diagrams, UML state machine diagrams, UML timing diagrams, UML use case diagrams.

Entity Relationship Diagram Symbols

The semantic modeling method nowadays is successfully applied in database structure design. It is effective method of modeling the data structures, which is based on the meaning of these data. As a tool of semantic modeling, there are used different types of Entity-Relationship Diagrams. Entity Relationship Diagram (ERD) is applied to visually and clearly represent a structure of a business database. The main components of ERDs are: entity, relation and attributes. An entity is a class of similar objects in the model, each entity is depicted in the form of rectangle and has the name expressed by a noun. Relation is shown in the form of non-directional line that connects two entities. There are several notation styles used for ERDs: information engineering style, Chen style, Bachman style, Martin Style. The Entity Relationship Diagram symbols used for professional ERD drawing are predesigned by professionals and collected in the libraries of the Entity-Relationship Diagram (ERD) solution for ConceptDraw DIAGRAM software.

Entity Relationship Diagram Software Engineering

Entity Relationship Diagram (aka ER Diagram, E-R Diagram, ERD) is a time-tested and widespread software development and software engineering method for data modeling, illustrating the logical structure of databases and system design. For ERDs construction are used three basic elements: entities, attributes, and relationships. Chen's notation for ERD supposes the use of rectangles (boxes) to represent entities and diamonds to depict relationships between first-class objects. This notation is popular when creating conceptual data models of information systems. Another standardized notation for ER diagrams is Crow's foot notation. ConceptDraw DIAGRAM as a powerful Entity Relationship Diagram software engineering provides the tools of Entity-Relationship Diagram (ERD) solution from Software Development area of ConceptDraw Solution Park for instantly describing databases using ERDs of Crow’s Foot and Chen’s notations. Use the predesigned vector elements for both these notations from 2 libraries included to Entity-Relationship Diagram (ERD) solution.