Pyramid Diagrams
Pyramid Diagrams solution extends ConceptDraw DIAGRAM software with templates, samples and library of vector stencils for drawing the marketing pyramid diagrams.
How to Create a Column Chart
The question how to create a column chart have a simple answer. Use ConceptDraw tips to find out how to create a column chart depicts your data the best way.Chart Templates
Easy charting software comes with beautiful chart templates and examples. This makes it easy to create professional charts without prior experience.
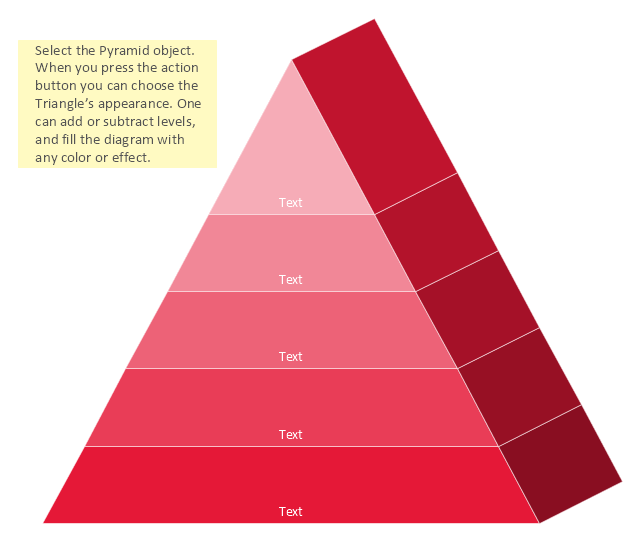
3D Triangle diagrams visualize the relationship building blocks as a triangle divided into horizontal slices, and may be oriented up or down. Labeled slices represent a hierarchy. They are used in marketing presentations to show and analyze hierarchy levels.
This 3D triangular diagram template for the ConceptDraw PRO diagramming and vector drawing software is included in the Pyramid Diagrams solution from the Marketing area of ConceptDraw Solution Park.
Data Flow Diagram (DFD)
A Data Flow Diagram (DFD) illustrates the flow of data through an information system, visualizes how the information is handled in terms of inputs and outputs, how the data enter to system and leave it. It is effective to use a Data Flow Diagram for creation the system's overview, to show the system's scope and boundaries. There are two different types of notations for DFDs: Yourdon-Coad and Gane-Sarson, which differ in visual representations for processes, data flow, data stores, external entities, etc. Thus, for example the processes are depicted as circles in Yourdon-Coad notation and as rounded squares in Gane-Sarson notation. Gane-Sarson notation is usually used for visualization information systems and Yourdon-Coad - for system analysis and design. The Data Flow Diagrams solution included to Software Development area of ConceptDraw Solution Park offers a lot of DFD templates, samples and examples, libraries of vector stencils for construction without efforts the DFDs according to both Gane-Sarson and Yourdon-Coad notations.Prioritization Matrix
You can design the Prioritization Matrix by hand on the paper, but we offer you the most easier way - to use the ConceptDraw DIAGRAM diagramming and vector drawing software extended with Seven Management and Planning Tools Solution from the Management Area.Flowchart design. Flowchart symbols, shapes, stencils and icons
A flowchart is a type of diagram which represents an algorithm, process or workflow, displays the steps as boxes of various kinds and depicts their order by connecting them with arrows. Any business graphic document will be more colorful and understandable if will use professional-looking and visual diagrams and flowcharts. Flowchart design gives versatile presenting and explaining of the process. ConceptDraw DIAGRAM flowchart software enhanced with Flowcharts solution helps effectively make Flowchart Design. Use of predesigned flowchart symbols and bright color palette offers a fresh view and favorably distinguishes the flowcharts designed in ConceptDraw DIAGRAM from the black and white flowcharts on a paper. Preferably to use no more than three or four colors and apply identical for the same shape types. The best flowchart design can be achieved by starting with Flowchart template, or any of suitable ready examples or samples offered in ConceptDraw STORE, open one of them and enter the proper text into each Flowchart shape. Each symbol of the flowchart has a definition that can't be changed. This means that all flowcharts shapes can be grouped in according to their meaning. Users with ConceptDraw DIAGRAM flowchart software can style groups of symbols with close definitions by color sets chosen from complementary palette. Almost all workflows can be depicted as a flowchart. Colored diagrams are more light for perception of the certain information, this is part of flowchart design. Bright colors need to be used in the key points of Decision symbols, to focus attention on their importance for whole process flow.
Sales Process Flowchart. Flowchart Examples
Sales Process Flowchart is an invaluable tool for business. It gives you opportunity to visualise and better understand the sales process, reveal and also visually highlight issues or bottlenecks, and predict the number of sales. The Flowchart is ideal method to represent in details all steps of the process, tasks and decisions needed to obtain maximum effectiveness and success. The steps are graphically represented by boxes linked with arrows indicating direction of the workflow, decision is shown by diamond. The sales process is closely linked to the company's success and usually includes the following main steps: Product knowledge, Prospecting, Planning the sale (Pre-approach), Approach, Need assessment, Presentation, Meeting objections, Gaining commitment, Follow-up. Create fast and easy your own Flowcharts of sales business processes using the ConceptDraw DIAGRAM ector graphic software extended with Cross-Functional Flowcharts solution from Business Processes area and also Sales Flowcharts solution from Marketing area of ConceptDraw Solution Park.Business Process Flowchart Symbols
Business process modeling is known in the corporate world as an excellent tool which can speak. Business process flowcharts, diagrams and maps are used to define the business processes in terms of inputs and outputs, to visually represent and effectively explain complex business processes of an enterprise, and also showcase decisions on a single piece of paper. The process of business process mapping supposes the use of special business process flowchart symbols predefined by Business Process Modeling Notation (BPMN) and taking their roots from the data processing diagrams and programming flow charts. In other words the BPMN standard notation is a common language used for business process design and implementation, that guarantees a clarity of designed Business Process Flowcharts for all business analysts, technical developers and business managers. The ability to create professionally-looking Business Process flowcharts, maps and diagrams, is provided by powerful ConceptDraw DIAGRAM software and the Business Process Mapping solution included to ConceptDraw Solution Park.How to Draw ER Diagrams
An Entity Relationship (ER) Diagram is a type of flowchart that illustrates the logical structure of databases, how the different entities, such as people, objects or concepts relate to each other within a given system. How to draw ER Diagrams fast and easy? ConceptDraw DIAGRAM diagramming and vector drawing software enhanced with Entity-Relationship Diagram (ERD) solution from Software Development area of ConceptDraw Solution Park offers you the powerful abilities of designing the ER Diagrams and ERD drawings without efforts. This solution includes a lot of predesigned icons advocated by popular Chen's and Crow’s Foot notations, which can be used when describing an enterprise database and depicting it by abstract way. Simply drag the required objects to ConceptDraw document, connect them in a desired way and make style settings. But the easiest and fastest way of drawing ERDs is to make them on the base of ready-to-use Chen ERD and Crow's Foot ERD templates, which are both represented at ConceptDraw STORE.- Pyramid Diagrams | Draw A Diagram Of Cpu With Labelled
- Basketball Court Diagram and Basketball Positions | Pyramid ...
- ConceptDraw Arrows10 Technology | Pyramid Diagrams | Fully ...
- 4 Level pyramid model diagram - Information systems types ...
- Baseball Diagram – Colored Baseball Field | Pyramid Diagram ...
- Diagram Of The Periodic Table Labelled
- Make The Diagram Of The Pyramid Of Development And Label It
- Basketball Court Diagram and Basketball Positions | Pyramid ...
- With The Aid Of A Well Labeled Diagram Describe The Elements Of
- Diagram Of A Volleyball Ball And Labelling
