This site uses cookies. By continuing to browse the ConceptDraw site you are agreeing to our Use of Site Cookies.

KPI Dashboard

ConceptDraw DIAGRAM diagramming and vector drawing software supplied with Sales Dashboard solution from the Marketing area of ConceptDraw Solution Park provides the full set of useful tools which make it the best for producing the live KPI Dashboard of any complexity.

A KPI Dashboard

Composing a dashboard from different KPI is a kind of art. Visualizing sales data you have to keep balance to keep your dashboard informative, not messy. ConceptDraw Sales Dashboard solution gives you a set of good examples of balanced dashboards.

Sales KPI Dashboards

A combination of sales KPI on a one dashboard helps you track sales activities and results. Visualizing sales data using ConceptDraw DIAGRAM software extended with the Sales Dashboard solutiongives you flexibility in choosing and tuning KPIs.

A KPI Dashboard Provides the Answers Your Sales Team

Sales dashboard is a tool that provides the answers to all questions your sales team may have. A mature sales dashboard provides complete set of KPI to shows corporate, team or personal performance to keep sales process clear.

KPIs and Metrics

The choice of KPIs and metrics you use is key point of success when measuring sales process. Visualizing sales data using ConceptDraw Sales Dashboard solution for ConceptDraw DIAGRAM gives you a choice from numerous pre-designed indicators for different metrics you may need.
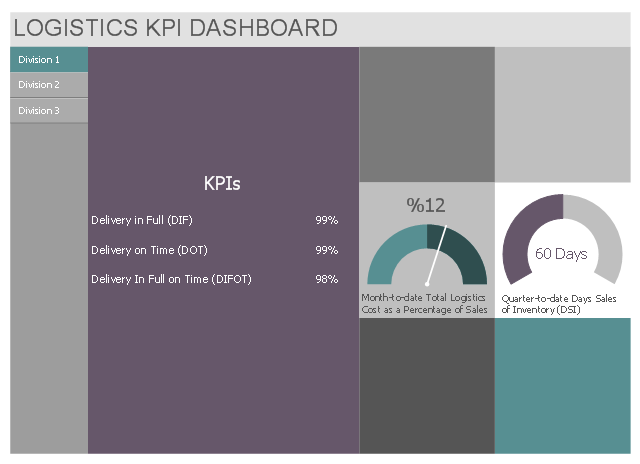
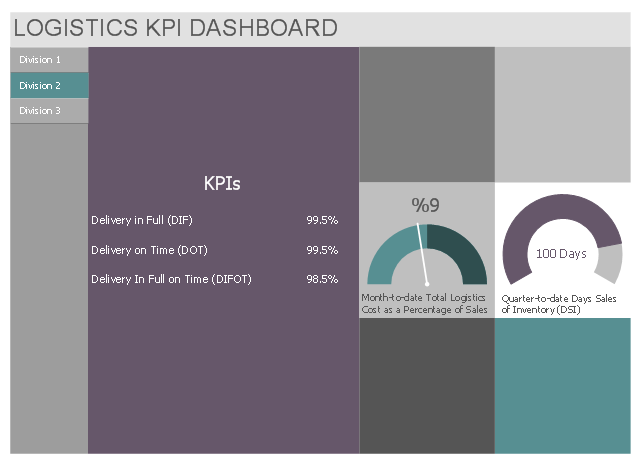
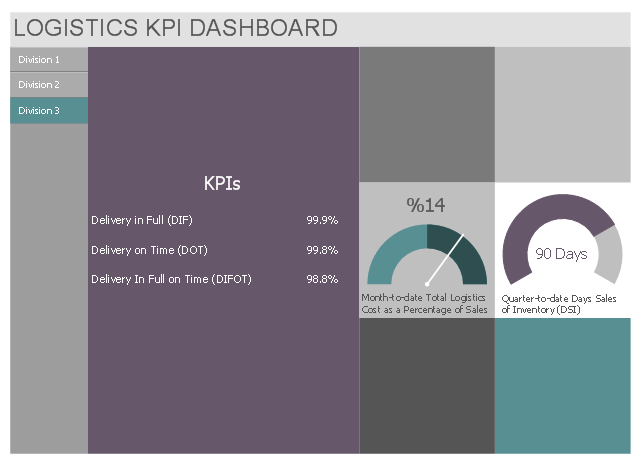
This multipage business dashboard template contains navigation vertical menu and graphic indicators of logistic key performance indicators (KPIs) and business metrics.
Use it to create your logistic KPI dashboard with ConceptDraw PRO software.
The performance dashboard template "Logistics KPI Dashboard" is included in Logistic Dashboard solution from Business Processes area of ConceptDraw Solution Park.
Division 1
Division 1, vertical menu, logistic indicators, multi digital values kpi, gauge indicator, kpi gauge, arc indicator, arc kpi,
Division 2
Division 2, vertical menu, logistic indicators, multi digital values kpi, gauge indicator, kpi gauge, arc indicator, arc kpi,
Division 3
Division 3, vertical menu, logistic indicators, multi digital values kpi, gauge indicator, kpi gauge, arc indicator, arc kpi,

The Facts and KPIs

Visualizing sales data help you see the facts and KPIs about your sales process to make conclusions and see how your business can improve.

Sales Dashboards for Your Company

ConceptDraw DIAGRAM software extended with the Sales Dashboard solution allows you produce sales dashboards for your company easily. You can start from samples and templates delivered with the solution and then modify them to get a dashboard that suites your specific needs.

Sales Dashboard Solutions can help your sales team keep an eye on performance

ConceptDraw Sales Dashboard Solution is a simple and effective way of visualizing sales data and get clear picture of your sales process to see how your business can improve.
HelpDesk

How to Use ConceptDraw Sales Dashboard Solution

An interactive visual dashboard is a valuable tool for any sales team. Sales dashboard allows you to view and monitor sales indicators that are important for manager and sales staff. It helps to use timely and reliable information to improve the quality of sales performance and increase sales revenues. ConceptDraw Sales Dashboard solution is a tool for both: sales manager and sales team. It provides the visualization of key performance indicators that are critical to the entire sales organization. The custom sales dashboard displays real-time information on sales performance KPIs with the help of intuitive and easy-to-understand diagrams and charts. Sales Dashboard helps the entire team see where they are, and what needs to be done. With ConceptDraw DIAGRAM you can easily create a visual Sales Dashboard using Live Objects Technology.