HelpDesk
How to Draw a Pyramid Diagram
Pyramid diagram (triangle diagram) is used to represent data, which have hierarchy and basics. Due to the triangular form of the diagram, each pyramid section has a different width. The width of the segment shows the level of its hierarchy. Typically, the top of the pyramid is the data that are more important than the base data. A pyramid scheme can be used to show proportional and hierarchical relationships between some logically related items, such as departments within an organization, or successive elements of any process. This type of diagram is often used in marketing to display hierarchically related data, but it can be used in a variety of situations. ConceptDraw DIAGRAM allows you to make a pyramid diagram, quickly and easily using special libraries.HelpDesk
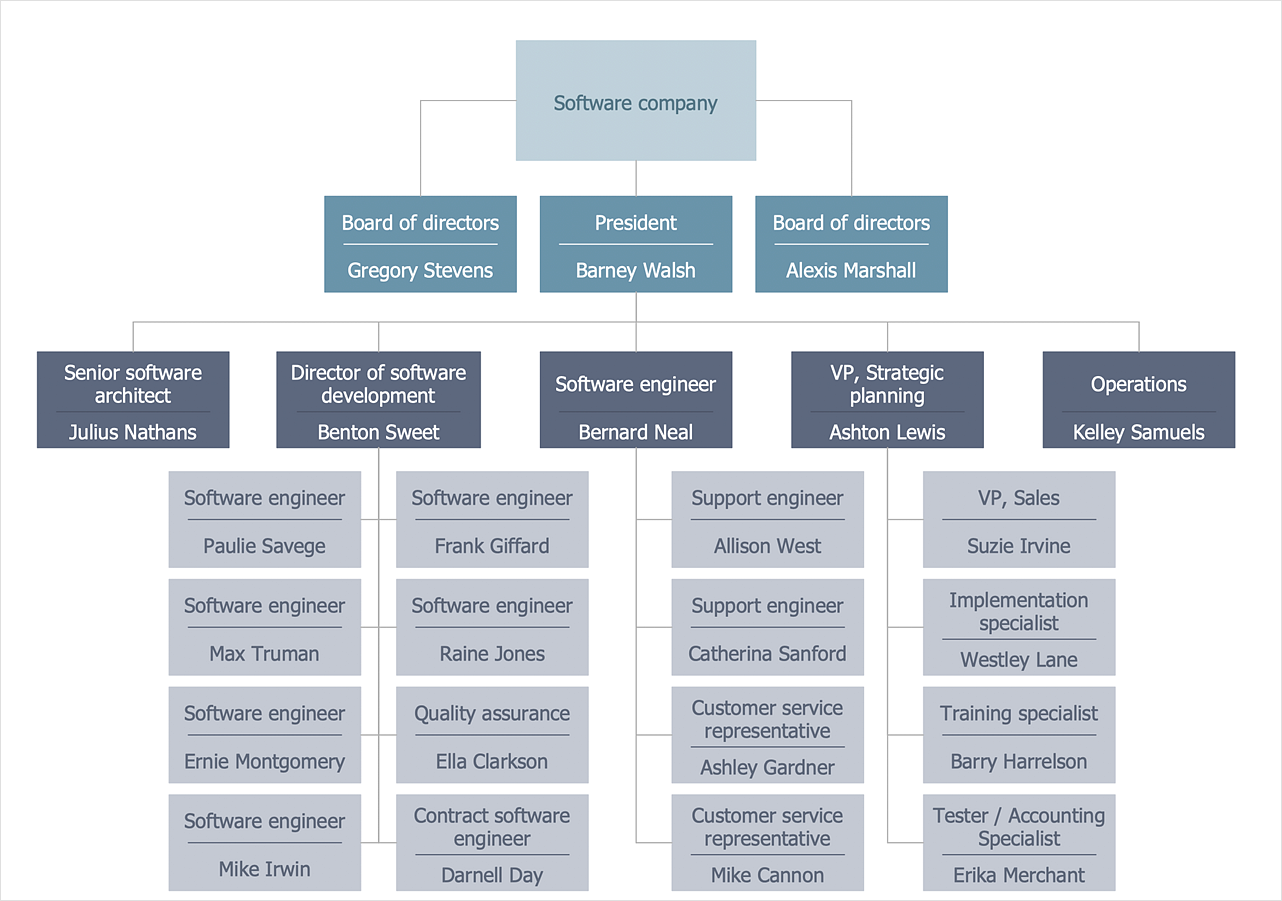
How to Draw a Hierarchical Organizational Chart
There are a number of different organizational structures. The most appropriate structure will depend on the size of the business and the type of business. A hierarchical organizational structure is one of the most typical organizational structure. This structure can be represented as a pyramid, with a single entity in authority at the top, with subsequent levels of power beneath them. Each member of the pyramid reports only to their direct subordinates or superiors, limiting the amount of communication overhead, which can be seen both as an asset or a limitation. It is easy to see where a hierarchical structure would be an effective solution; companies that have offices based in disparate locations, a business that focuses on diversified markets, any organization with a need for multiple levels of middle management. You can easily create a clear hierarchical organizational chart using ConceptDraw solution that contains templates of the 25 Typical Orgcharts.HelpDesk
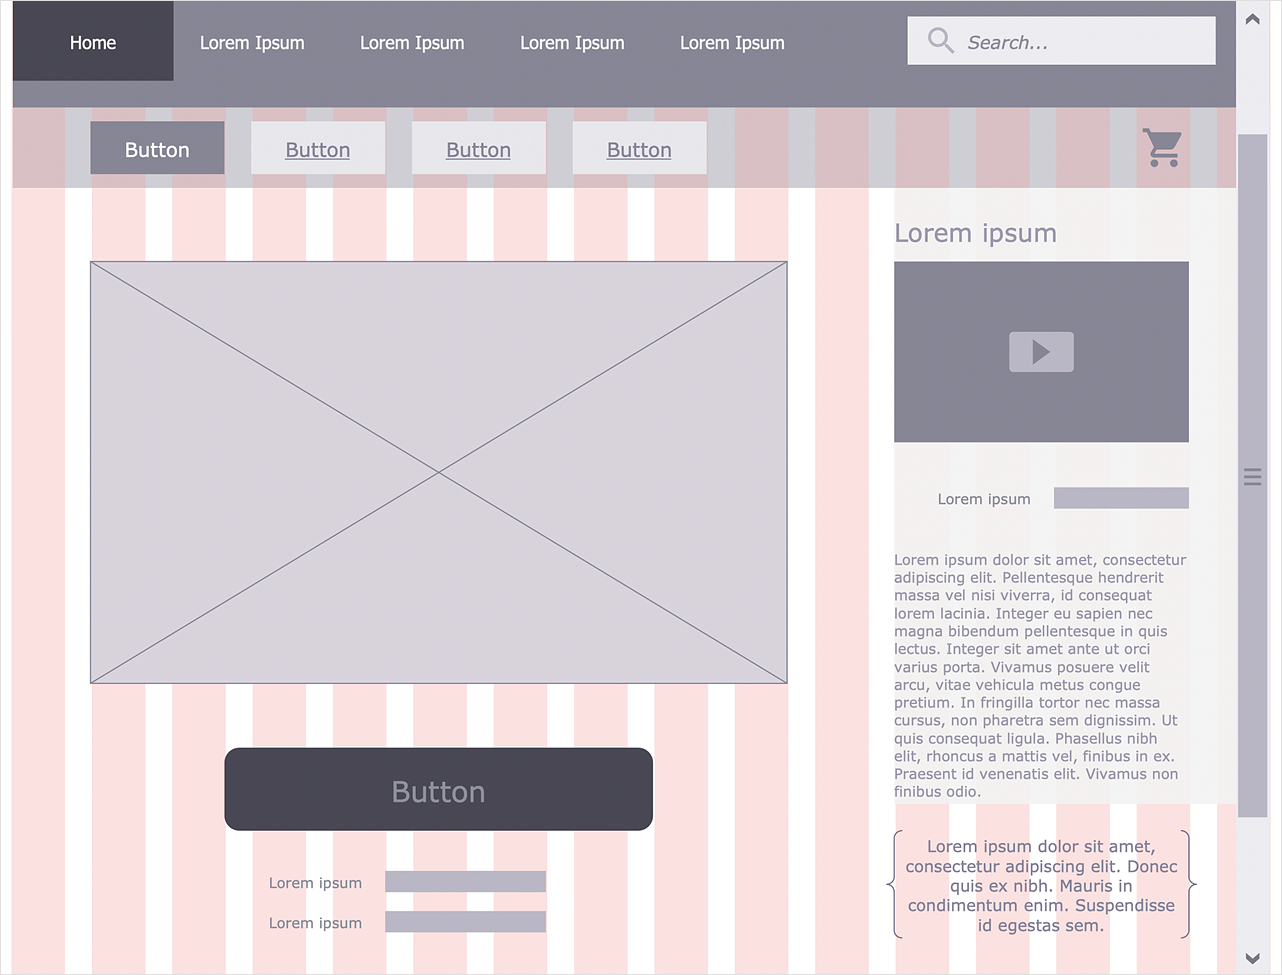
How to Develop Website Wireframes
Website design is a rather complicated process. The development of a website wireframe is an important step in any screen design process. The first step of this process before coding can start, a web designer creates a website wireframe — a mock-up for what will be displayed on the screen when navigating through the web site pages. A wireframe design always includes three components: Information design, navigation design, and interface design. The configuration of these components depends on the business model of the website. The Website Wireframing tools provided with ConceptDraw Website Wireframe solution helps to define the information hierarchy of website design, making it easier for web-developers to plan the layout according to how a site visitor has to process the information.HelpDesk
What Information to be Displayed in the ConceptDraw PROJECT Gantt Chart View
What information can contain the project task list? Gantt Chart view is a graphical representation of a project outline that allows one to allocate tasks. You can customize a project’s tasks list view to include the columns you need to meet your information requirements. The columns of the ConceptDraw PROJECT Gantt view contain the information you want to capture about each task in your project. The following article details what information can be contained in the columns of a project outline:<HelpDesk
How to Add a Bubble Diagram to PowerPoint Presentation
Bubble diagrams can be used to compare concepts, and identify areas of similarity and difference. ConceptDraw DIAGRAM allows you to make a MS PowerPoint Presentation from your charts in a few simple steps.HelpDesk
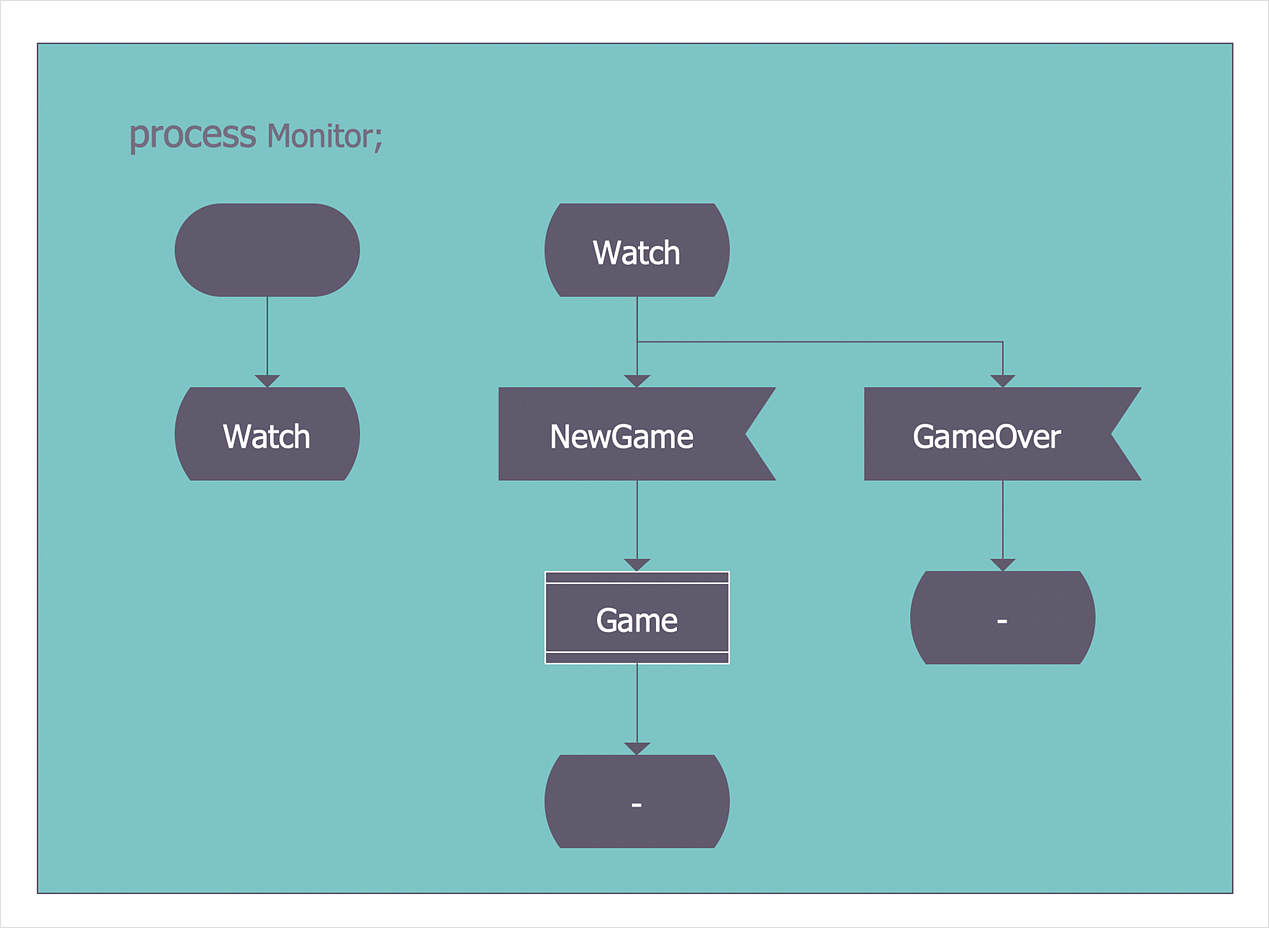
How to Create an SDL Diagram
Specification and Description Language (SDL) is intended to describe systems that switched state often and rapidly. An SDL diagram is a view of a system, that can depict a single process or complex relationships between a number of elements. The SDL diagram supports a nested hierarchy. A system is divided into blocks, each of them can be described as a process until finally, one can see the initial procedures that make up each process. The advantage of this method is that a system can be viewed in a manageable part that can be followed separately. ConceptDraw Specification and Description Language solution contains the library, with an SDL notation in a vector stencil graphics. The SDL solution also provides a set of samples, to show the level of hierarchical detail that is possible.HelpDesk
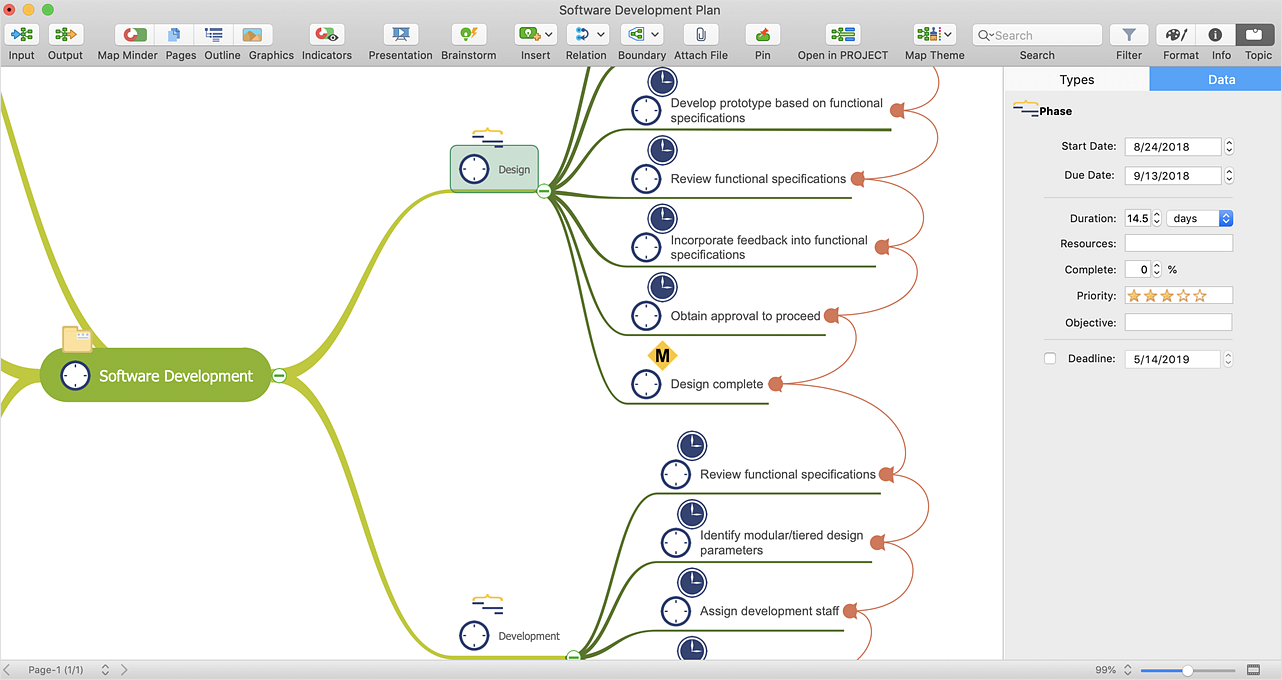
How to Import MS Project File to a Mind Map Using the Project Exchange Solution
ConceptDraw MINDMAP can export a mind map to MS Project; it can also import a project file from MS Project, making a working visual map of a planned project. ConceptDraw MINDMAP supports inputting external data into a map with one click. Input capabilities are critical because it makes your data visual. When your data is visual, you can manage and communicate it using newly generated documents and/or presentations. Data you can input into your map can come from just about anywhere. Data can come from Microsoft Word, Excel, Outlook, Project, the web, a mind map, and other electronic sources. You can input data as a task list, resource list, Gantt chart, brainstorm or search results.HelpDesk
Accounting Information Systems Flowchart Symbols
Accounting Information system is a combination of software and hardware, as well as organizational support. Information system - it is not only the software and computers with network equipment, but also a list of instructions and standards which can be notated using Accounting information systems flowchart symbols. All information systems can be divided into information retrieval and data processing systems. Data Flow model is a hierarchical model. Each process can be divided into structural components, that depict by corresponding flowchart symbols, showing the accounting information system in communication with the external environment. The major components of accounting information systems flowchart are: entities, processes, data stores, and data flows. The set of standard accounting information flowchart symbols is intended to show the relationships between the system components. ConceptDraw DIAGRAM can help to draw clear accounting information system diagrams using special flowchart symbols.Software development with ConceptDraw DIAGRAM
Modern software development requires creation of large amount of graphic documentation, these are the diagrams describing the work of applications in various notations and cuts, also GUI design and documentation on project management. ConceptDraw DIAGRAM technical and business graphics application possesses powerful tools for software development and designing technical documentation for object-oriented projects. Solutions included to the Software Development area of ConceptDraw Solution Park provide the specialists with possibility easily and quickly create graphic documentation. They deliver effective help in drawing thanks to the included package of templates, samples, examples, and libraries with numerous ready-to-use vector objects that allow easily design class hierarchies, object hierarchies, visual object-oriented designs, flowcharts, GUI designs, database designs, visualize the data with use of the most popular notations, including the UML and Booch notations, easy manage the development projects, automate projection and development.Business Diagram Software
When managing the projects, people, or networks, there are daily designed and used different types of Business diagrams, so the powerful drawing software will be very useful for this. ConceptDraw DIAGRAM with large quantity of business solutions will meet your needs and will help you convey your ideas successful and rapidly, no matter are you professional or beginner. It is the best choice for business specialists and technical professionals who need quickly and easily explore, visualize, and communicate information. ConceptDraw DIAGRAM business diagram software is the most powerful business software and relational charting software. Create advanced, completely customizable Business Process Diagrams, Business Flow Charts, Work Flow Diagrams, Organizational Charts, Audit diagrams, Marketing diagrams, Value Stream Maps, TQM diagrams, ERD diagrams, EPC diagrams, Cause and Effect diagrams, Infographics, Dashboards, and other Relational business diagrams from your data using the powerful drawing tools of ConceptDraw Solution Park.
HelpDesk
How to Create a Fishbone (Ishikawa) Diagram Quickly
A Fishbone (Ishikawa) diagram is also called cause-and-effect diagram. Fishbone diagram is often used in business to determine the cause of some problem. The diagram illustrates the main causes and sub-causes leading to an event. The main goal of the Fishbone diagram is to illustrate in a graphical way the relationship between a given outcome and all the factors that influence this outcome. The complete diagram resembles a fish skeleton as its name implies. The ability to create a Fishbone Diagram is supported by the Fishbone Diagram solution. Use ConceptDraw MINDMAP for structuring data and then ConceptDraw DIAGRAM for generating a Fishbone Diagram from mind map structure.- How to Draw a Pyramid Diagram in ConceptDraw PRO | KPI ...
- KPI Dashboard | What is a KPI ? | How to Add a Circle-spoke ...
- KPI Dashboard | What is a KPI ? | Sales Dashboard | Kpi Powerpoint ...
- Help Desk Kpi Examples
- How To Create Project Report | The Facts and KPIs | How to ...
- Sales KPIs and Metrics - Vector stencils library | KPI Dashboard ...
- The Facts and KPIs | How to Connect Tabular Data (CSV) to a ...
- KPI Dashboard | Enterprise dashboard | Visualize Sales Data Using ...
- Kpi Design Shapes
- KPI Dashboard | Performance Indicators | What is a KPI ? | Kpi ...
- Employee Kpi Template Excel
- Sales metrics and KPIs - Visual dashboard | Website KPIs - Visual ...
- Kpi Hr
- PM Dashboards | ConceptDraw Solution Park | The Facts and KPIs ...
- Website KPIs - Visual dashboard | Projects HR dashboard | PM ...
- KPI Dashboard | Dashboard | How To Create the Interaction ...
- Kpi Infographics
- Contoh Kpi Engineering
- PM Dashboards | How To Create Project Report | A KPI Dashboard ...
- Engineering Kpi Dashboard


