This site uses cookies. By continuing to browse the ConceptDraw site you are agreeing to our Use of Site Cookies.
HelpDesk

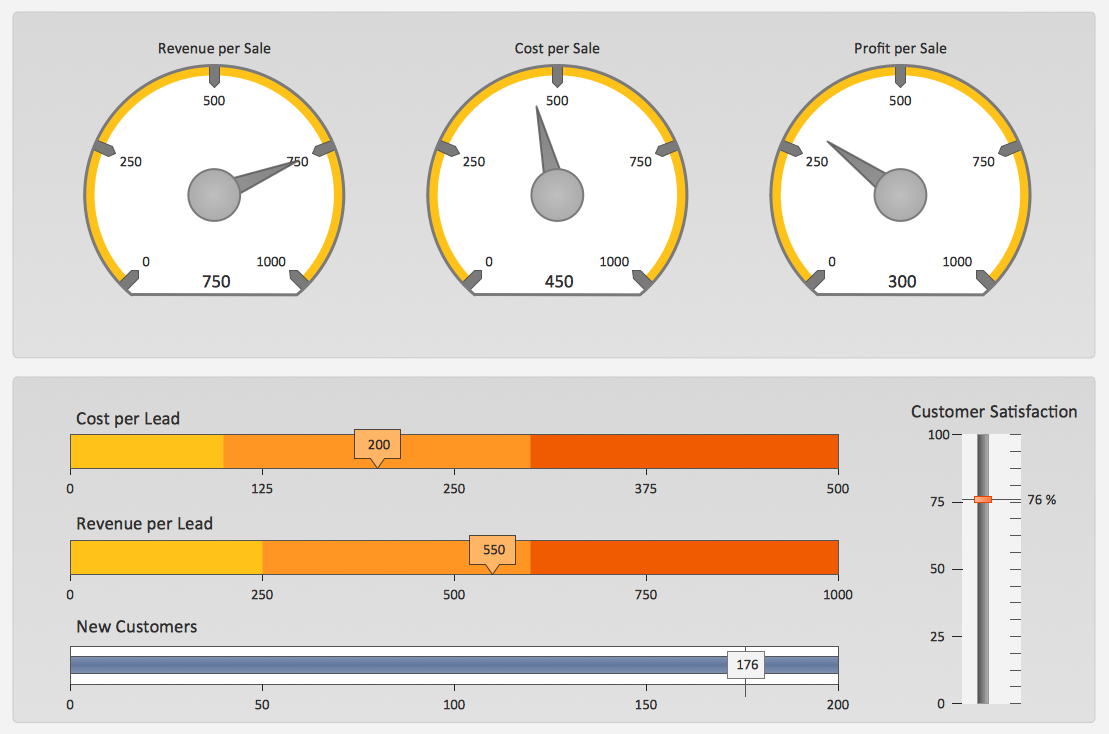
How to Create a Meter Dashboard

ConceptDraw Meter Dashboard solution is design to support creating interactive indicator such as Gauges, Meters, Bullets and Sliders. It is based on a Live Object technology. Live Meters indicators are used to show various types of quantitative data, and can be arranged into a dashboard. The dashboard displays the actual data from the data source files with regular updates every 5 seconds.

Sales KPI Dashboards

A combination of sales KPI on a one dashboard helps you track sales activities and results. Visualizing sales data using ConceptDraw DIAGRAM software extended with the Sales Dashboard solutiongives you flexibility in choosing and tuning KPIs.

A KPI Dashboard Provides the Answers Your Sales Team

Sales dashboard is a tool that provides the answers to all questions your sales team may have. A mature sales dashboard provides complete set of KPI to shows corporate, team or personal performance to keep sales process clear.

Measure the Progress

Visualizing sales data using Sales Dashboard solution for ConceptDraw DIAGRAM helps you measure the progress of your sales team. You can measure corporate, team and personal progress combining different KPI on your sales dashboard.

What is a KPI?

What is a KPI? Key performance indicators (KPIs) represent a set of measures that are focused on the aspects of organizational performance which are the most important for its current and future success.
ConceptDraw DIAGRAM diagramming and vector drawing software enhanced with Sales Dashboard solution from the Marketing area of ConceptDraw Solution Park allows effectively develop, analyze and improve your business thanks to the excellent possibility of monitoring all KPIs on one screen in a real time.

logistics management Logistic Dashboard

logistics management
The powerful tools of Logistic Dashboard solution and specially developed live graphic objects of logistic icons, logistic navigation elements, logistic indicators, logistic charts and logistic maps effectively assist in designing Logistic dashboards, Logistic maps, Logistic charts, diagrams and infographics. The included set of prebuilt samples and quick-start templates, demonstrates the power of ConceptDraw DIAGRAM software in logistics management, its assisting abilities in development, realization and analyzing the logistic processes, as well as in perfection the methods of logistics management.
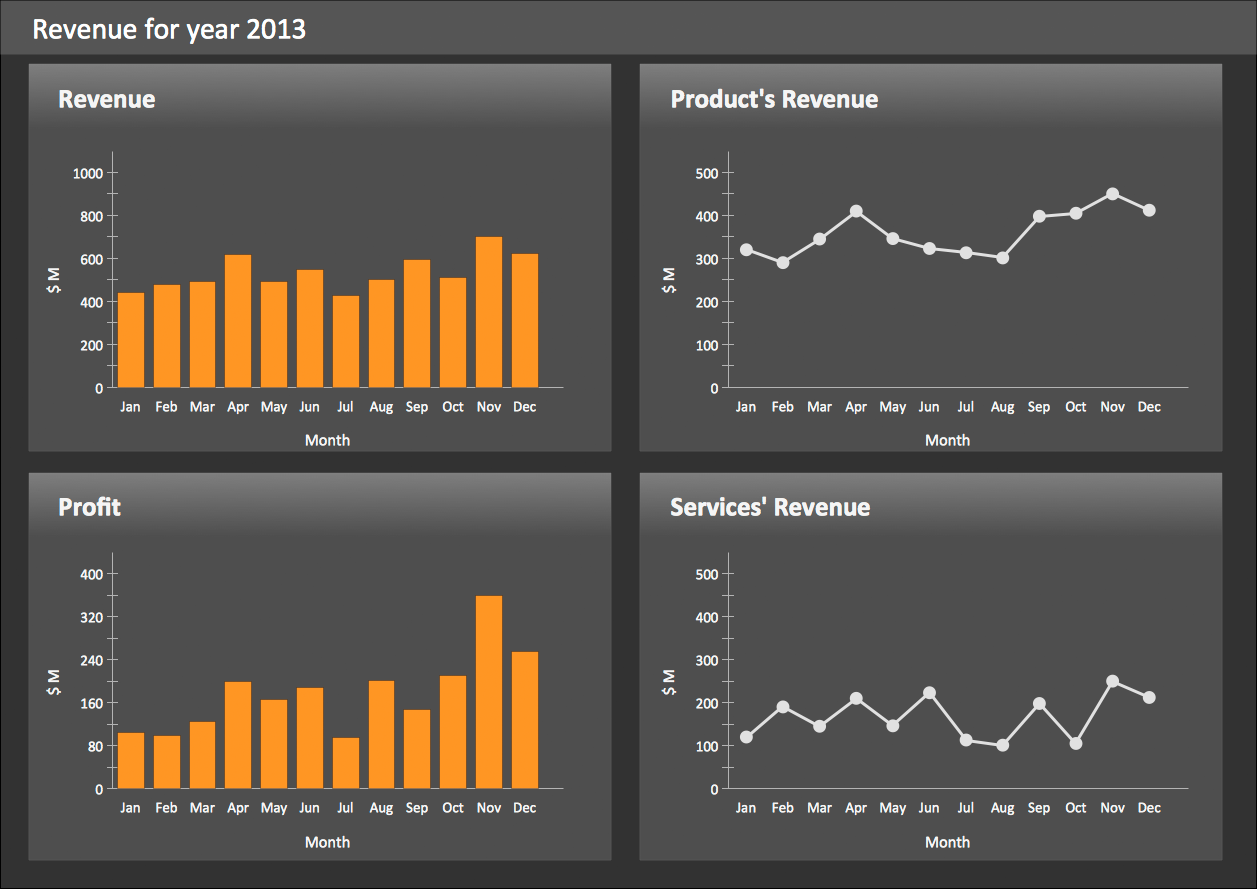
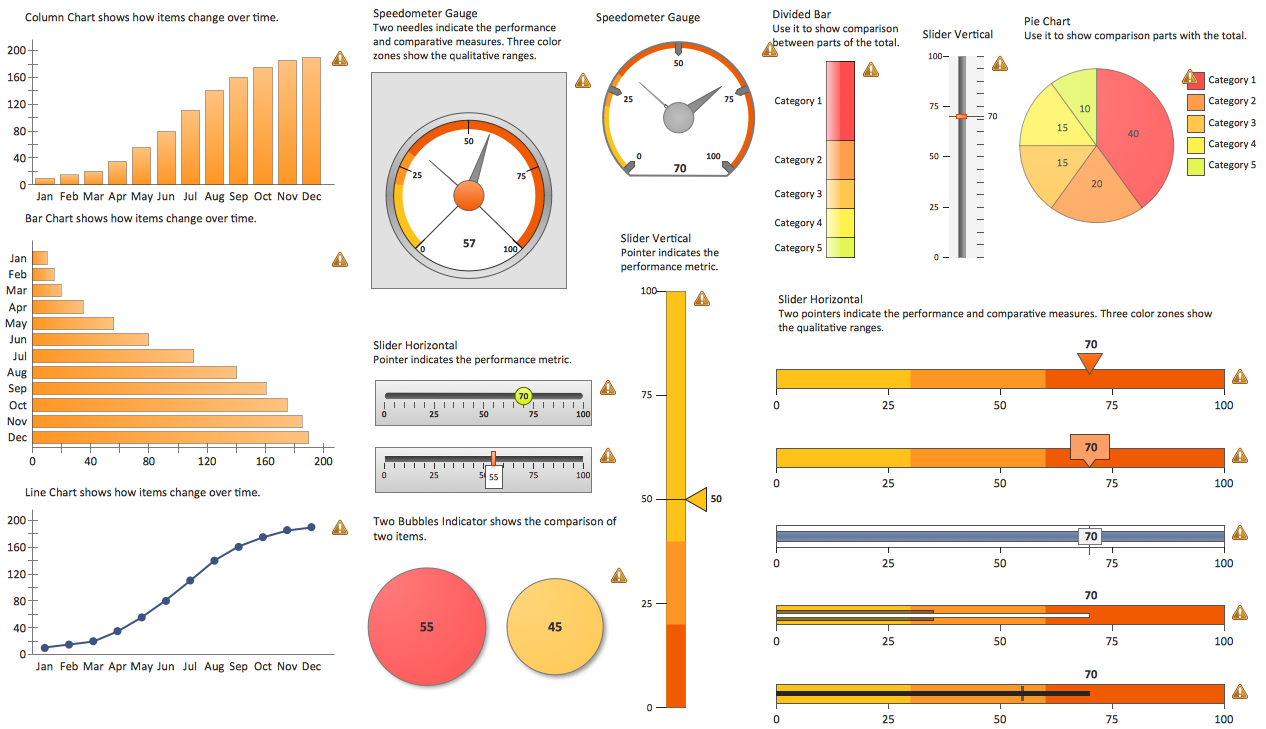
sales dashboard, sales metrics Sales Dashboard

sales dashboard, sales metrics
Sales Dashboard solution extends ConceptDraw DIAGRAM software with templates, samples and library of vector stencils for drawing the visual dashboards of sale metrics and key performance indicators (KPI).

Sales Dashboard Examples

Visualizing sales data you may need a good example to start. ConceptDraw Sales Dashboard solution delivers a complete set of templates and samples you can use as examples to start composing your own sales dashboard.

Sales Dashboards for Your Company

ConceptDraw DIAGRAM software extended with the Sales Dashboard solution allows you produce sales dashboards for your company easily. You can start from samples and templates delivered with the solution and then modify them to get a dashboard that suites your specific needs.

Sales Dashboard Template

ConceptDraw DIAGRAM software extended with the Sales Dashboard solution delivers a complete set of samples, templates and pre-designed objects you need for visualizing sales data.