This site uses cookies. By continuing to browse the ConceptDraw site you are agreeing to our Use of Site Cookies.

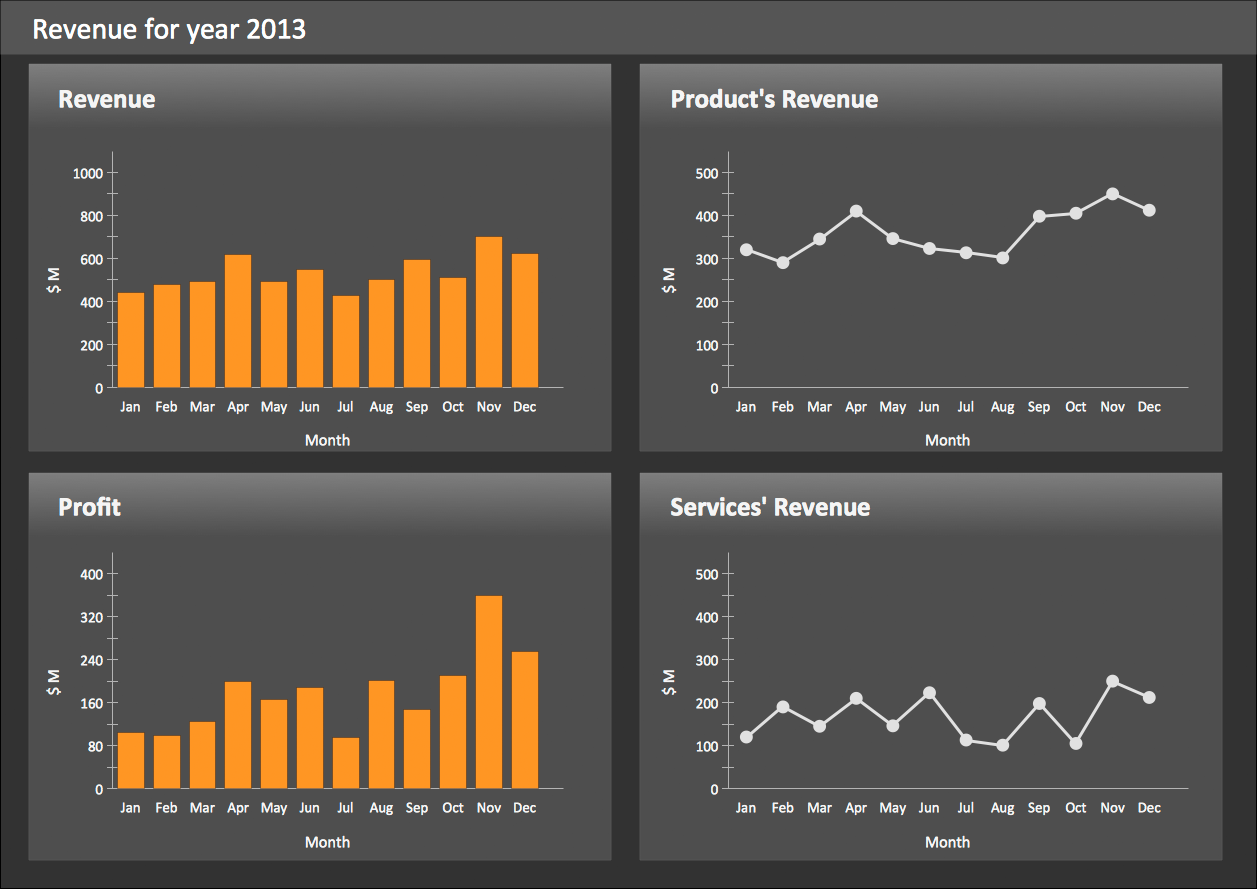
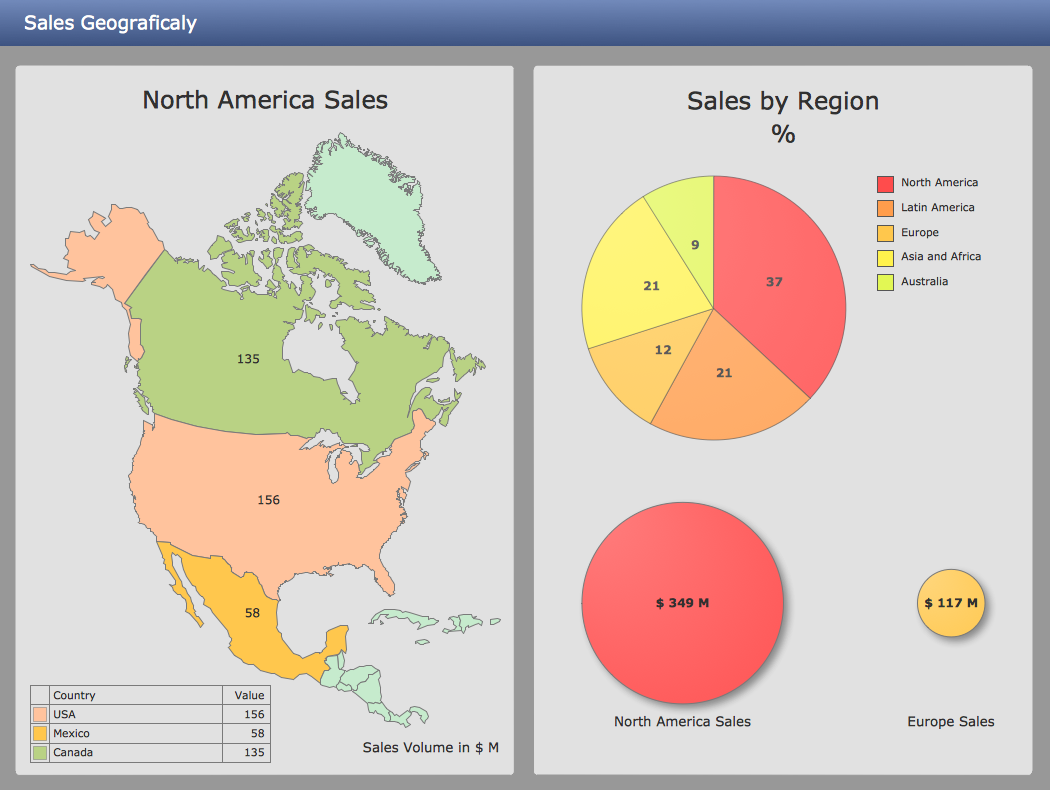
Sales KPI Dashboards

A combination of sales KPI on a one dashboard helps you track sales activities and results. Visualizing sales data using ConceptDraw DIAGRAM software extended with the Sales Dashboard solutiongives you flexibility in choosing and tuning KPIs.

KPIs and Metrics

The choice of KPIs and metrics you use is key point of success when measuring sales process. Visualizing sales data using ConceptDraw Sales Dashboard solution for ConceptDraw DIAGRAM gives you a choice from numerous pre-designed indicators for different metrics you may need.
HelpDesk

How to Use ConceptDraw Sales Dashboard Solution

An interactive visual dashboard is a valuable tool for any sales team. Sales dashboard allows you to view and monitor sales indicators that are important for manager and sales staff. It helps to use timely and reliable information to improve the quality of sales performance and increase sales revenues. ConceptDraw Sales Dashboard solution is a tool for both: sales manager and sales team. It provides the visualization of key performance indicators that are critical to the entire sales organization. The custom sales dashboard displays real-time information on sales performance KPIs with the help of intuitive and easy-to-understand diagrams and charts. Sales Dashboard helps the entire team see where they are, and what needs to be done. With ConceptDraw DIAGRAM you can easily create a visual Sales Dashboard using Live Objects Technology.

The Facts and KPIs

Visualizing sales data help you see the facts and KPIs about your sales process to make conclusions and see how your business can improve.

logistics management Logistic Dashboard

logistics management
The powerful tools of Logistic Dashboard solution and specially developed live graphic objects of logistic icons, logistic navigation elements, logistic indicators, logistic charts and logistic maps effectively assist in designing Logistic dashboards, Logistic maps, Logistic charts, diagrams and infographics. The included set of prebuilt samples and quick-start templates, demonstrates the power of ConceptDraw DIAGRAM software in logistics management, its assisting abilities in development, realization and analyzing the logistic processes, as well as in perfection the methods of logistics management.

A KPI Dashboard

Composing a dashboard from different KPI is a kind of art. Visualizing sales data you have to keep balance to keep your dashboard informative, not messy. ConceptDraw Sales Dashboard solution gives you a set of good examples of balanced dashboards.

What is a KPI?

What is a KPI? Key performance indicators (KPIs) represent a set of measures that are focused on the aspects of organizational performance which are the most important for its current and future success.
ConceptDraw DIAGRAM diagramming and vector drawing software enhanced with Sales Dashboard solution from the Marketing area of ConceptDraw Solution Park allows effectively develop, analyze and improve your business thanks to the excellent possibility of monitoring all KPIs on one screen in a real time.

crm software, crm tools, customer management software CRM Center Dashboard

crm software, crm tools, customer management software
The CRM Center Dashboard solution extends ConceptDraw DIAGRAM functionality with CRM software tools, large collection of CRM Charts live objects, CRM icons, CRM indicators, CRM maps and navigation elements, the set of professionally designed CRM samples and templates to help you construct your own CRM Dashboards and CRM Center Dashboards in a few minutes, to depict the current and actual data by connecting or refreshing the data source file. The customer management software ConceptDraw DIAGRAM makes you free to choose the style for your dashboard and to regulate the quantity of clipart on the diagram according to your taste.

Ways You Can Visualize Sales Data

There are lots of ways you can visualize sales data, and the simplest way is using ConceptDraw Sales Dashboard solution for ConceptDraw DIAGRAM. You just need to connect your data to one of pre-designed dashboards, and then you can see dynamic picture of changes.

Constant improvement of key performance indicators

There are available tool to lend a fresh look to quality procedures - ConceptDraw MINDMAP.