Basic Flowchart Symbols and Meaning


HelpDesk
How to Create PDCA Diagram

Agile Methodology

Process Flowchart


SSADM Diagram

BPR Diagram. Business Process Reengineering Example

 Plan-Do-Check-Act (PDCA)
Plan-Do-Check-Act (PDCA) solution extends the ConceptDraw DIAGRAM software with collection of samples and predesigned vector objects for easy visualization four stages of PDCA cycle, PDSA cycle, or Deming cycle, for illustration effective application of this method to the practical business tasks, for depiction the implementation of changes and solution the problems in business processes. Plan-Do-Check-Act (PDCA) solution helps to design professional-looking and attractive Plan Do Study Act diagrams, PDCA cycle diagrams, PDCA Process diagrams, and to construct the Quality Management Process Models, which all assist to manage efficiently the business processes, to improve quality of work and to reduce significantly the costs.
Scrum

This circle diagram sample was redesigned from the Wikimedia Commons file: Research cycle.png. "Some of the basic elements of the scientific method, arranged in a cycle to emphasize that it is an iterative process." [commons.wikimedia.org/ wiki/ File:Research_ cycle.png]
This file is licensed under the Creative Commons Attribution 2.0 Generic license. [creativecommons.org/ licenses/ by/ 2.0/ deed.en]
"The scientific method is a body of techniques for investigating phenomena, acquiring new knowledge, or correcting and integrating previous knowledge. To be termed scientific, a method of inquiry must be based on empirical and measurable evidence subject to specific principles of reasoning. ...
Four essential elements of the scientific method are iterations, recursions, interleavings, or orderings of the following:
(1) Characterizations (observations, definitions, and measurements of the subject of inquiry).
(2) Hypotheses (theoretical, hypothetical explanations of observations and measurements of the subject).
(3) Predictions (reasoning including logical deduction from the hypothesis or theory).
(4) Experiments (tests of all of the above)...
A linearized, pragmatic scheme of the four points above is sometimes offered as a guideline for proceeding:
(1) Define a question.
(2) Gather information and resources (observe).
(3) Form an explanatory hypothesis.
(4) Test the hypothesis by performing an experiment and collecting data in a reproducible manner.
(5) Analyze the data.
(6) Interpret the data and draw conclusions that serve as a starting point for new hypothesis.
(7) Publish results.
(8) Retest (frequently done by other scientists).
The iterative cycle inherent in this step-by-step method goes from point 3 to 6 back to 3 again." [Scientific method. Wikipedia]
The circle diagram example "Research cycle" was created using the ConceptDraw PRO diagramming and vector drawing software extended with the Target and Circular Diagrams solution from the Marketing area of ConceptDraw Solution Park.
www.conceptdraw.com/ solution-park/ marketing-target-and-circular-diagrams
Circle diagram

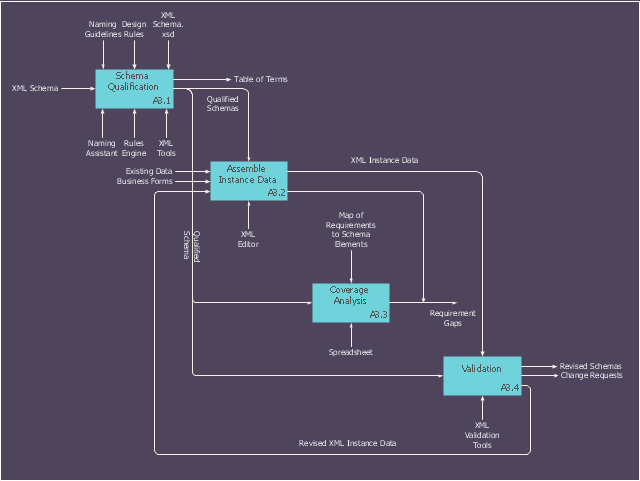
This IDEF0 diagram sample was created on the base of the figure from the website of the Engineering Laboratory of the National Institute of Standards and Technology (NIST). [mel.nist.gov/ msidlibrary/ doc/ kc_ morris/ gsa-final_ files/ image011.gif]
"Verification and Validation of Computer Simulation Models is conducted during the development of a simulation model with the ultimate goal of producing an accurate and credible model.
"Simulation models are increasingly being used to solve problems and to aid in decision-making. The developers and users of these models, the decision makers using information obtained from the results of these models, and the individuals affected by decisions based on such models are all rightly concerned with whether a model and its results are “correct”". This concern is addressed through verification and validation of the simulation model.
Simulation models are approximate imitations of real-world systems and they never exactly imitate the real-world system. Due to that, a model should be verified and validated to the degree needed for the models intended purpose or application.
The verification and validation of simulation model starts after functional specifications have been documented and initial model development has been completed. Verification and validation is an iterative process that takes place throughout the development of a model." [Verification and Validation of Computer Simulation Models. Wikipedia]
The IDEF0 diagram example "Model validation" was created using the ConceptDraw PRO diagramming and vector drawing software extended with the IDEF0 Diagrams solution from the Software Development area of ConceptDraw Solution Park.
IDEF0 diagram
- Agile Methodology | SSADM Diagram | Basic Flowchart Symbols ...
- Basic Flowchart Symbols and Meaning | Process Flowchart | BPR ...
- Process Flowchart | Basic Flowchart Symbols and Meaning | Agile ...
- Basic Flowchart Symbols and Meaning | Process Flowchart ...
- Flowchart Software Iterative Or Iteration Example
- Basic Flowchart Symbols and Meaning | Yourdon and Coad ...
- Basic Flowchart Symbols and Meaning | Process Flowchart ...
- Iterative Flow Chart
- Flowchart Software Iterative