 Network Security Diagrams
The Network Security Diagrams solution presents a large collection of predesigned cybersecurity vector stencils, cliparts, shapes, icons and connectors to help you succeed in designing professional and accurate Network Security Diagrams, Network Security Infographics to share knowledge about effective ways of networks protection with help of software and network security devices of different cyber security degrees, Network Plans for secure wireless network, Computer Security Diagrams to visually tell about amazing possibilities of IT security solutions. The samples and examples reflect the power of ConceptDraw DIAGRAM software in drawing Network Security Diagrams, give the representation about variety of existing types of attacks and threats, help to realize their seriousness and the methods to deal with them.
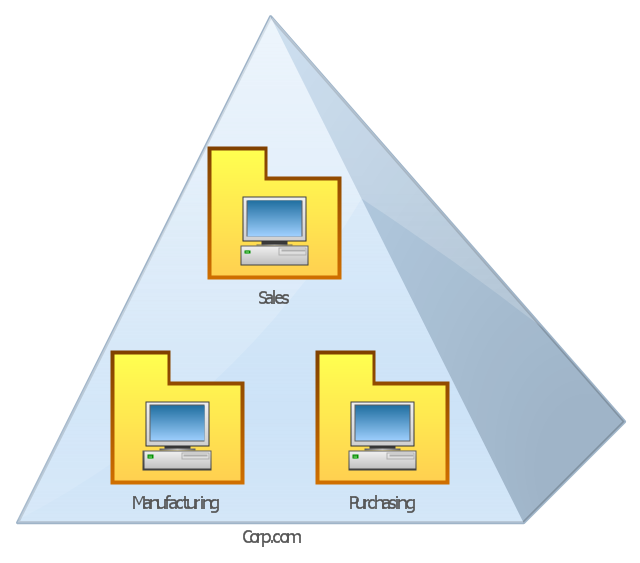
This AD diagram example was redesigned from the picture "Single root domain with a structured OU model" from the book "Active Directory for Dummies".
"A domain is the cornerstone that you lay whenever you create trees and forests. Regardless of whether you design a tree or a forest, the starting point is always the root domain. The root domain is the first domain that you create in your AD structure, and it sits at the top of your diagram.
The root domain of your tree, similar to any other domain, is a grouping of
resources built on the following components:
(1) Domain controllers.
(2) Security policies. ...
For many small and medium-sized companies, a single root domain with a
structured OU (organizational unit) model... provides sufficient flexibility for an AD tree. ...
However, larger companies, companies with complex organization charts, and
companies with multiple sites often find that a single domain isn’t suitable." [Steve Clines and Marcia Loughry, Active Directory® For Dummies®, 2nd Edition. 2008]
The Active Directory diagram example "Single root domain with a structured OU model" was created using the ConceptDraw PRO diagramming and vector drawing software extended with the Active Directory Diagrams solution from the Computer and Networks area of ConceptDraw Solution Park.
Active Directory network diagram
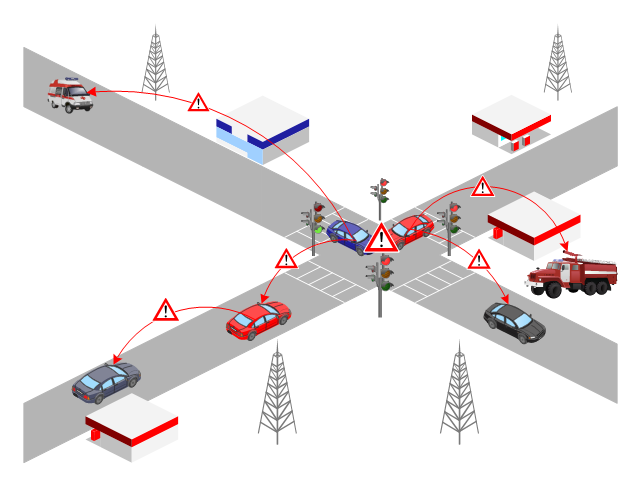
This VANET diagram example was drawn on the base of picture from the webpage "Security and Privacy in Location-based MANETs/ VANETs" from the Donald Bren School of Information and Computer Sciences, the University of California, Irvine. [ics.uci.edu/ ~keldefra/ manet.htm]
"A vehicular ad hoc network (VANET) uses cars as mobile nodes in a MANET to create a mobile network. A VANET turns every participating car into a wireless router or node, allowing cars approximately 100 to 300 metres of each other to connect and, in turn, create a network with a wide range. As cars fall out of the signal range and drop out of the network, other cars can join in, connecting vehicles to one another so that a mobile Internet is created. It is estimated that the first systems that will integrate this technology are police and fire vehicles to communicate with each other for safety purposes. Automotive companies like General Motors, Toyota, Nissan, DaimlerChrysler, BMW and Ford promote this term." [Vehicular ad hoc network. Wikipedia]
The VANET diagram example "Vehicular ad-hoc network" was created using the ConceptDraw PRO diagramming and vector drawing software extended with the Vehicular Networking solution from the Computer and Networks area of ConceptDraw Solution Park.
VANET diagram
Business diagrams & Org Charts with ConceptDraw DIAGRAM


 25 Typical Orgcharts
The 25 Typical Orgcharts solution contains powerful organizational structure and organizational management drawing tools, a variety of professionally designed organization chart and matrix organization structure samples, 25 templates based on various orga
Emergency Plan


 Event-driven Process Chain Diagrams
Event-Driven Process Chain Diagrams solution extends ConceptDraw DIAGRAM functionality with event driven process chain templates, samples of EPC engineering and modeling the business processes, and a vector shape library for drawing the EPC diagrams and EPC flowcharts of any complexity. It is one of EPC IT solutions that assist the marketing experts, business specialists, engineers, educators and researchers in resources planning and improving the business processes using the EPC flowchart or EPC diagram. Use the EPC solutions tools to construct the chain of events and functions, to illustrate the structure of a business process control flow, to describe people and tasks for execution the business processes, to identify the inefficient businesses processes and measures required to make them efficient.
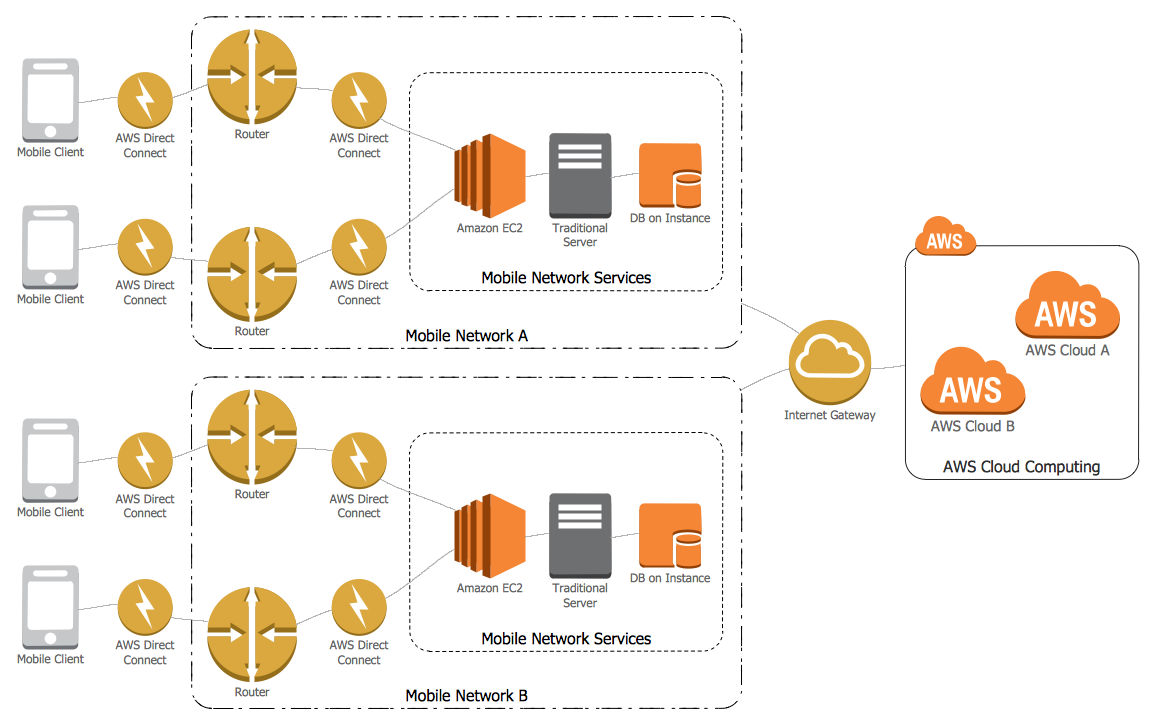
Amazon Cloud
 Cross-Functional Flowcharts
Cross-functional flowcharts are powerful and useful tool for visualizing and analyzing complex business processes which requires involvement of multiple people, teams or even departments. They let clearly represent a sequence of the process steps, the order of operations, relationships between processes and responsible functional units (such as departments or positions).
 Project Management Area
Project Management area provides Toolbox solutions to support solving issues related to planning, tracking, milestones, events, resource usage, and other typical project management functions.
This example visual dashboard example shows website traffic metrics. Divided bar chart and pie chart are used to visualize compositional data. Scatter plot is used to visually analyse correlation between two data sets.
"Web traffic is the amount of data sent and received by visitors to a web site. ...
This is determined by the number of visitors and the number of pages they visit. Sites monitor the incoming and outgoing traffic to see which parts or pages of their site are popular and if there are any apparent trends, such as one specific page being viewed mostly by people in a particular country. There are many ways to monitor this traffic and the gathered data is used to help structure sites, highlight security problems or indicate a potential lack of bandwidth not all web traffic is welcome. Some companies offer advertising schemes that, in return for increased web traffic (visitors), pay for screen space on the site. Sites also often aim to increase their web traffic through inclusion on search engines and through search engine optimization." [Web traffic. Wikipedia]
The example "Website traffic dashboard" was created using the ConceptDraw PRO diagramming and vector drawing software extended with the Corellation Dashboard solution from the area "What is a Dashboard" of ConceptDraw Solution Park.
Visual dashboard

UML Class Diagram Example - Buildings and Rooms

- Conceptdraw.com: Mind Map Software, Drawing Tools | Project ...
- Active Directory Domain Services | Active Directory Diagram | Single ...
- Single root domain with a structured OU model | Active Directory ...
- Active Directory Diagram | Active Directory Domain Services ...
- Diagram Of Bucket
- Wireless Network WAN | Network Diagram Software LAN Network ...
- Active Directory Diagram
- How to Make an Ansoff Matrix Template in ConceptDraw PRO ...
- Structure Of Active Directory With Diagram
- Swim Lane Flowchart Symbols | Social Media Flowchart Symbols ...
- Active Directory Diagram | Active Directory Domain Services ...
- Active Directory Domain Services | Active Directory Diagram | Active ...
- Organizational Units | Network Diagramming Software for Network ...
- Lan To Wan Visio Example
- Design Element: Active Directory for Network Diagrams | Network ...
- Network Diagram Software Enterprise Private Network | Virtual ...
- Think and act effectively | Percent of students achieved a 36 on ACT ...
- Workflow diagram - Earthquake disaster assessment | Audit failure ...
- Website traffic dashboard | Website KPIs - Visual dashboard ...
- Building Drawing Software for Design Office Layout Plan | Office ...