Rainfall Bar Chart

Relative Value Chart Software

Bar Diagrams for Problem Solving. Create event management bar charts with Bar Graphs Solution

Financial Comparison Chart

Bar Diagrams for Problem Solving. Create economics and financial bar charts with Bar Graphs Solution

Bar Chart

Pie Donut Chart. Pie Chart Examples

Pyramid Diagram

Bar Chart Software

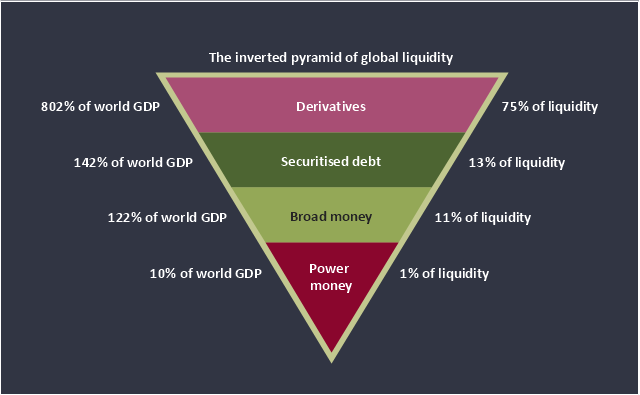
This inverted pyramid diagram of global liquidity shows world GDP and liquidity for 4 levels: derivatives, securitised debt, broad money, and power money.
"In business, economics or investment, market liquidity is a market's ability to facilitate an asset being sold quickly without having to reduce its price very much (or even at all). Equivalently, an asset's market liquidity (or simply "an asset's liquidity") is the asset's ability to sell quickly without having to reduce its price very much. Liquidity is about how big the trade-off is between the speed of the sale and the price it can be sold for. In a liquid market, the trade-off is mild: selling quickly will not reduce the price much. In a relatively illiquid market, selling it quickly will require cutting its price by some amount.
Money, or cash, is the most liquid asset, because it can be "sold" for goods and services instantly with no loss of value. There is no wait for a suitable buyer of the cash. There is no trade-off between speed and value. It can be used immediately to perform economic actions like buying, selling, or paying debt, meeting immediate wants and needs.
If an asset is moderately (or very) liquid, it has moderate (or high) liquidity. In an alternative definition, liquidity can mean the amount of highly liquid assets. If a business has moderate liquidity, it has a moderate amount of very liquid assets. If a business has sufficient liquidity, it has a sufficient amount of very liquid assets and the ability to meet its payment obligations." [Market liquidity. Wikipedia]
This inverted triangle diagram was redesigned using the ConceptDraw PRO diagramming and vector drawing software from Wikimedia Commons file The inverted pyramid of global liquidity.gif. [commons.wikimedia.org/ wiki/ File:The_ inverted_ pyramid_ of_ global_ liquidity.gif]
This triangular chart example is included in the Pyramid Diagrams solution from the Marketing area of ConceptDraw Solution Park.
Inverted pyramid diagram
 Seven Basic Tools of Quality
Manage quality control in the workplace, using fishbone diagrams, flowcharts, Pareto charts and histograms, provided by the Seven Basic Tools of Quality solution.
Remote Projects in Corporate Strategy


Risk Diagram (Process Decision Program Chart)
")
 Cross-Functional Flowcharts
Cross-functional flowcharts are powerful and useful tool for visualizing and analyzing complex business processes which requires involvement of multiple people, teams or even departments. They let clearly represent a sequence of the process steps, the order of operations, relationships between processes and responsible functional units (such as departments or positions).
 HR Flowcharts
Human resource management diagrams show recruitment models, the hiring process and human resource development of human resources.
- Basic Flowchart Symbols and Meaning | Investment and ...
- Pyramid Ratio Diagram In Accounting
- Relative Value Chart Software | Pyramid Chart Examples | Pie Chart ...
- Pyramid Charts | Pyramid Diagram | Pyramid Diagram | Image Of ...
- Information Technology Architecture | 5 Level pyramid model ...
- Pyramid Chart Examples | Workflow Process Example | Relative ...
- Marketing Plan Infographic | Pie Donut Chart . Pie Chart Examples ...
- Pyramid Chart Of Ratio
- Pyramid Chart Examples | Energy Pyramid Diagram | Diagram of a ...
- Relative Value Chart Software | How to Create a Pyramid Diagram ...
- Venn Diagram | Bar Diagrams for Problem Solving. Create ...
- Rainfall Bar Chart | Financial Comparison Chart | Pie Chart Software ...
- Pyramid Chart Examples | Pyramid Diagram and Pyramid Chart ...
- Pyramid Diagram | Global liquidity inverted pyramid diagram ...
- Bar Chart | Bio Flowchart Lite | Relative Value Chart Software ...
- Pyramid Diagram and Pyramid Chart | Pyramid Diagram | Sales ...
- Any Bar Graph Regarding Sustainable Development
- Pyramid Chart Examples | Pyramid Diagram | Ansoff Matrix | Matrix ...
- Pyramid Diagram | Diagram of a Pyramid | Global liquidity inverted ...
- How to Create a Pyramid Diagram | Bar Diagram Math | Pyramid ...