Pyramid Diagram and Pyramid Chart

Flowchart Maker

Spider Chart Template

The Best Flowchart Software Available


Check Order Process Flowchart. Flowchart Examples

Activity on Node Network Diagramming Tool

Stakeholder Mapping Tool

Flow Chart Symbols

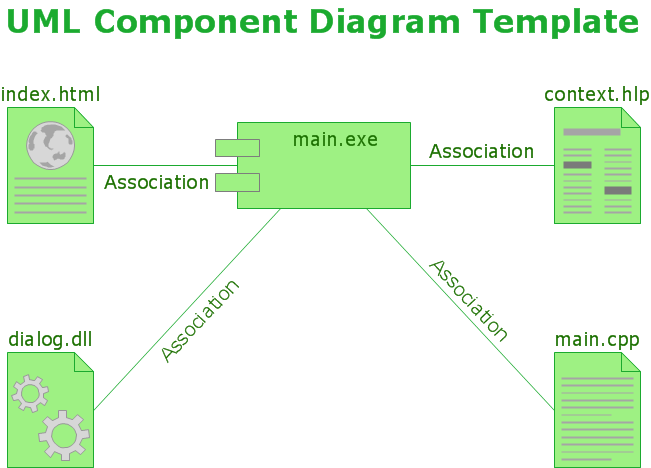
UML Component Diagram

 Block Diagrams
Block diagrams solution extends ConceptDraw DIAGRAM software with templates, samples and libraries of vector stencils for drawing the block diagrams.
- Interactive Decision Tree Template
- Interactive Decision Tree Software
- Interactive Decision Tree
- Product Overview | Benefits Of Using Decision Trees
- Flowcharts | Interactive Decision Tree Theme
- Fault Tree Diagram | Marketing Charts | IDEF0 Visio | Decision Tree ...
- Decision Tree Web Design
- Tree Structure Web Design
- Seating Plans | Free Graph Builder