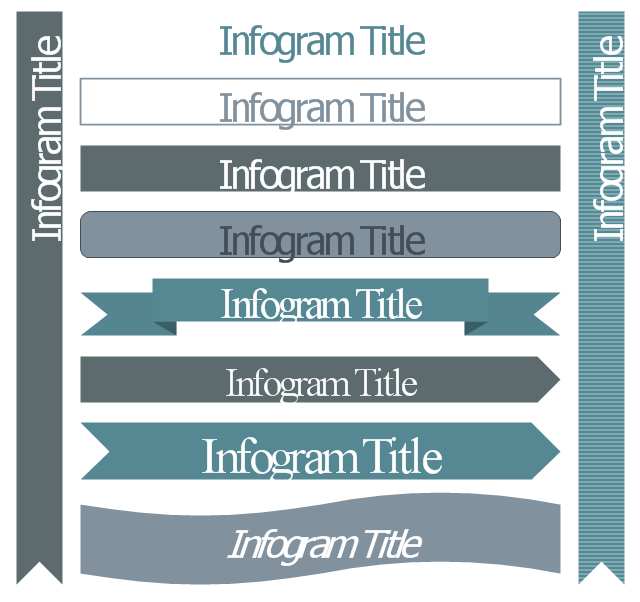
The vector stencils library "Management title blocks" contains 10 shapes: rectangle, rounded rectangle, ribbon, arrow, flag, bookmark.
Use it to design your management infogram.
The titles example "Design elements - Management title blocks" was created using the ConceptDraw PRO diagramming and vector drawing software extended with the Management Infographics solition from the area "Business Infographics" in ConceptDraw Solution Park.
Infographic titles
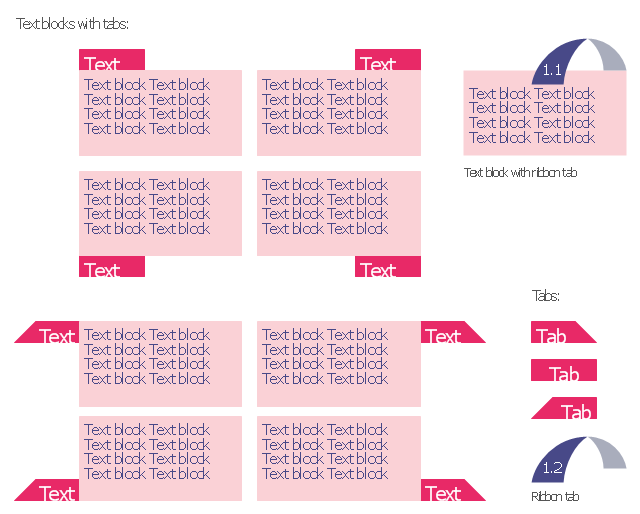
The vector stencils library "Tabbed text blocks" contains 13 tabs and tabbed text blocks. Use it to add typography elements into your infographics.
"In interface design, a tabbed document interface (TDI) or Tab is a graphical control element that allows multiple documents or panels to be contained within a single window, using tabs as a navigational widget for switching between sets of documents. It is an interface style most commonly associated with web browsers, web applications, text editors, and preference panes.
GUI tabs are modeled after traditional card tabs inserted in paper files or card indexes (in keeping with the desktop metaphor)." [Tab (GUI). Wikipedia]
The example "Tabbed text blocks" was created using the ConceptDraw PRO diagramming and vector drawing software extended with the Typography Infographics solition from the area "What is infographics" in ConceptDraw Solution Park.
Typography infographics elements - Tabbed text blocks
HelpDesk
How to Draw a Block Diagram in ConceptDraw PRO

 Block Diagrams
Block diagrams solution extends ConceptDraw PRO software with templates, samples and libraries of vector stencils for drawing the block diagrams.
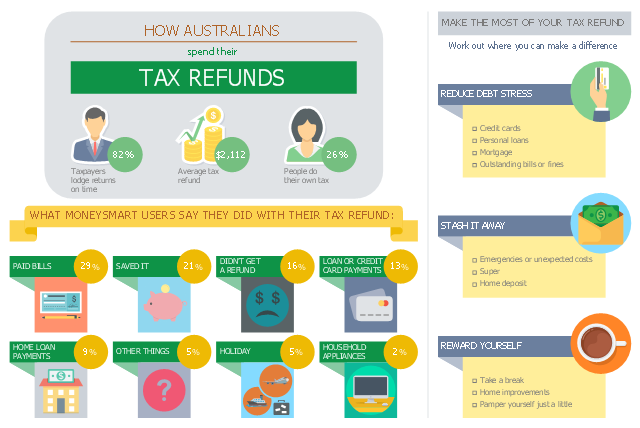
This business infographic sample shows the average tax refund and how people say they spent last year's tax refund. It was designed on the base of the infographic "How Australians spend their tax refunds" from the MoneySmart website of the Australian Securities and Investments Commission (ASIC).
[moneysmart.gov.au/ managing-your-money/ income-tax/ how-australians-spend-their-tax-refunds]
"A tax refund or tax rebate is a refund on taxes when the tax liability is less than the taxes paid. Taxpayers can often get a tax refund on their income tax if the tax they owe is less than the sum of the total amount of the withholding taxes and estimated taxes that they paid, plus the refundable tax credits that they claim. (Tax refunds are money given back at the end of the financial year.)" [Tax refund. Wikipedia]
The business infographic example "How Australians spend their tax refunds" was designed using ConceptDraw PRO diagramming and vector drawing software extended with the Business and Finance solution from Illustration area of ConceptDraw Solution Park.
Infographic
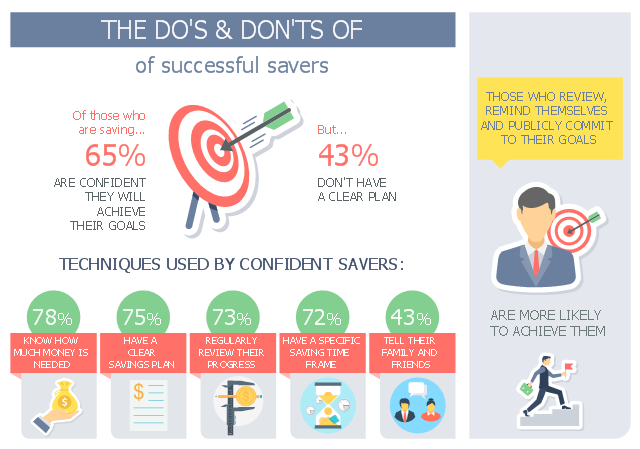
This business infographic sample shows how Australians save money, people's different saving styles as well as the techniques used by successful savers. It was designed on the base of the infographic "How Australians save money" from the MoneySmart website of the Australian Securities and Investments Commission (ASIC).
[moneysmart.gov.au/ managing-your-money/ saving/ how-australians-save-money]
"Saving is income not spent, or deferred consumption. Methods of saving include putting money aside in, for example, a deposit account, a pension account, an investment fund, or as cash. Saving also involves reducing expenditures, such as recurring costs. In terms of personal finance, saving generally specifies low-risk preservation of money, as in a deposit account, versus investment, wherein risk is higher; in economics more broadly, it refers to any income not used for immediate consumption." [Saving. Wikipedia]
The business infographic example "Do's and Don'ts of successful savers" was designed using ConceptDraw PRO diagramming and vector drawing software extended with the Business and Finance solution from Illustration area of ConceptDraw Solution Park.
Infographic
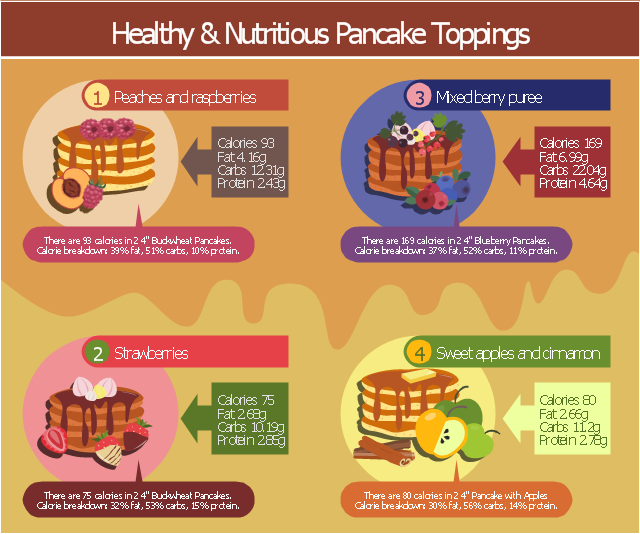
This food infogram example visualizes ideas of pancake toppings.
"A pancake is a flat cake, often thin, and round, prepared from a starch-based batter that may also contain eggs and butter and cooked on a hot surface such as a griddle or frying pan, often with oil or butter. In Britain, pancakes are often unleavened, and resemble a crêpe. In North America, a raising agent is used (typically baking powder). The North American pancake is similar to a Scotch pancake or drop scone.
They may be served at any time with a variety of toppings or fillings including jam, fruit, syrup, chocolate chips, or meat. In America, they are typically considered to be a breakfast food." [en.wikipedia.org/ wiki/ Pancake]
The meal infographic example "Healthy and nutritious pancake toppings" was drawn using the ConceptDraw PRO diagramming and vector drawing software extended with the Food Court solution from the Food and Beverages area of ConceptDraw Solution Park.
Food court infographic
HelpDesk
How to Create a Typography Infographic Using ConceptDraw PRO

HelpDesk
How To Create a MS Visio Block Diagram Using ConceptDraw PRO

HelpDesk
How to Add a Block Diagram to a PowerPoint Presentation Using ConceptDraw PRO

This business infographic sample shows how Australians save money, people's different saving styles as well as the techniques used by successful savers. It was designed on the base of the infographic "How Australians save money" from the MoneySmart website of the Australian Securities and Investments Commission (ASIC).
[moneysmart.gov.au/ managing-your-money/ saving/ how-australians-save-money]
"Saving is income not spent, or deferred consumption. Methods of saving include putting money aside in, for example, a deposit account, a pension account, an investment fund, or as cash. Saving also involves reducing expenditures, such as recurring costs. In terms of personal finance, saving generally specifies low-risk preservation of money, as in a deposit account, versus investment, wherein risk is higher; in economics more broadly, it refers to any income not used for immediate consumption." [Saving. Wikipedia]
The business infographic example "Do's and Don'ts of successful savers" was designed using ConceptDraw PRO diagramming and vector drawing software extended with the Business and Finance solution from Illustration area of ConceptDraw Solution Park.
[moneysmart.gov.au/ managing-your-money/ saving/ how-australians-save-money]
"Saving is income not spent, or deferred consumption. Methods of saving include putting money aside in, for example, a deposit account, a pension account, an investment fund, or as cash. Saving also involves reducing expenditures, such as recurring costs. In terms of personal finance, saving generally specifies low-risk preservation of money, as in a deposit account, versus investment, wherein risk is higher; in economics more broadly, it refers to any income not used for immediate consumption." [Saving. Wikipedia]
The business infographic example "Do's and Don'ts of successful savers" was designed using ConceptDraw PRO diagramming and vector drawing software extended with the Business and Finance solution from Illustration area of ConceptDraw Solution Park.
Infographic
HelpDesk
How To Convert a Block Diagram to Adobe PDF Using ConceptDraw PRO

- Design elements - Management title blocks | Design elements ...
- Best Tool for Infographic Construction | Organizational Structure ...
- Design elements - Titles | Design elements - Title blocks | Design ...
- Process Flowchart | PM Planning | What are Infographic Area | Send ...
- Callout Title Blocks
- Infographic Rectangle Block
- Design elements - Management title blocks | Design elements ...
- Flat design floor plan | Apartment plan | What are Infographic Area ...
- Design elements - Titles | Design elements - Management title ...
- Design elements - Title blocks | Design elements - Education title ...
- Design elements - Management title blocks
- How to Draw a Landscape Design Plan | Design elements ...
- Design elements - Text blocks | CMP adaptive management cycle ...
- Functional Flow Block Diagram | Block Diagrams | UML Use Case ...
- Design elements - Education list blocks | Design elements - Scrum ...
- Blocks Pictogram
- Design elements - Bulleted and numbered lists | Design elements ...
- How to Create a Typography Infographic Using ConceptDraw PRO ...
- HVAC Marketing Plan | Block diagram - Six markets model | Pyramid ...
- How to Draw Pictorial Chart. How to Use Infograms | Sample ...