Excellent Examples of Infographic Maps
Make an Infographic
How to Make an Infographic
Infographic Maker

Typography Infographic Software
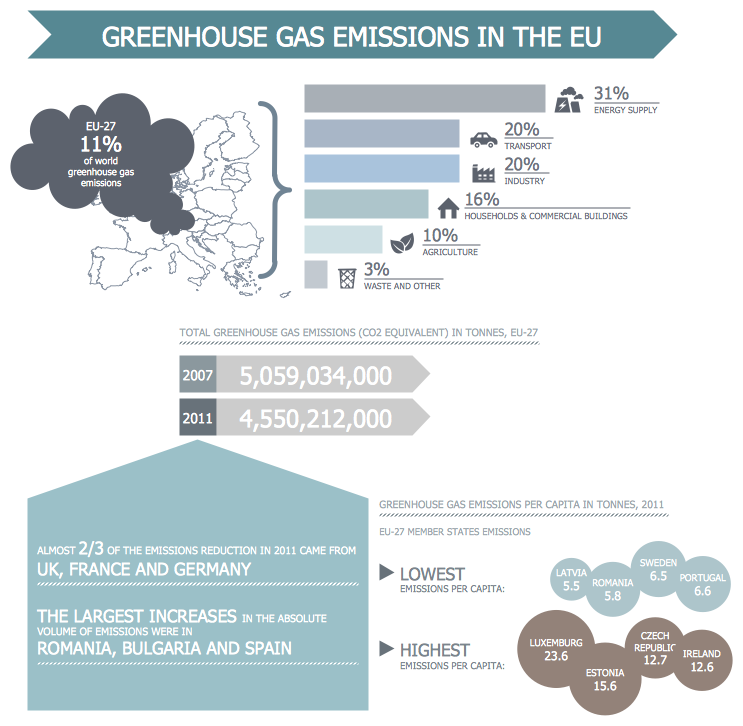
"A greenhouse gas (sometimes abbreviated GHG) is a gas in an atmosphere that absorbs and emits radiation within the thermal infrared range. This process is the fundamental cause of the greenhouse effect. The primary greenhouse gases in the Earth's atmosphere are water vapor, carbon dioxide, methane, nitrous oxide, and ozone. Greenhouse gases greatly affect the temperature of the Earth; without them, Earth's surface would average about 33 °C colder, which is about 59 °F below the present average of 14 °C (57 °F)." [Greenhouse gas. Wikipedia]
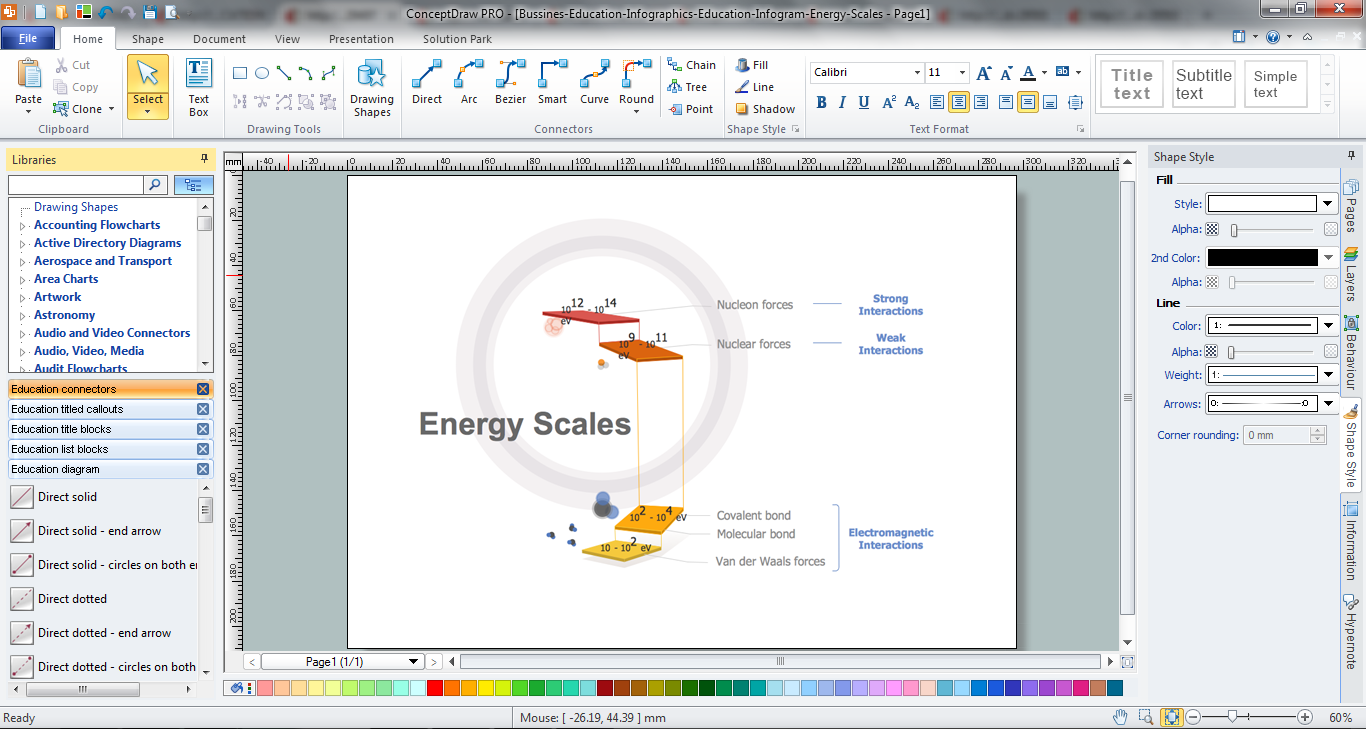
The ecology infographic example "EU greenhouse gas emissions" was created using the ConceptDraw PRO diagramming and vector drawing software extended with the Management Infographics solition from the area "Business Infographics" in ConceptDraw Solution Park.

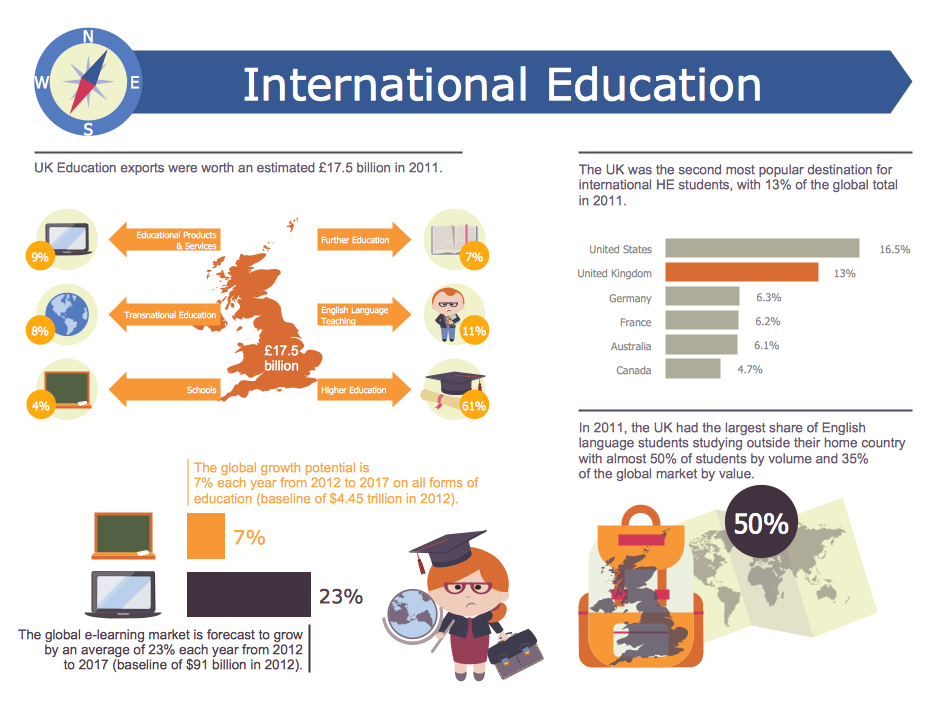
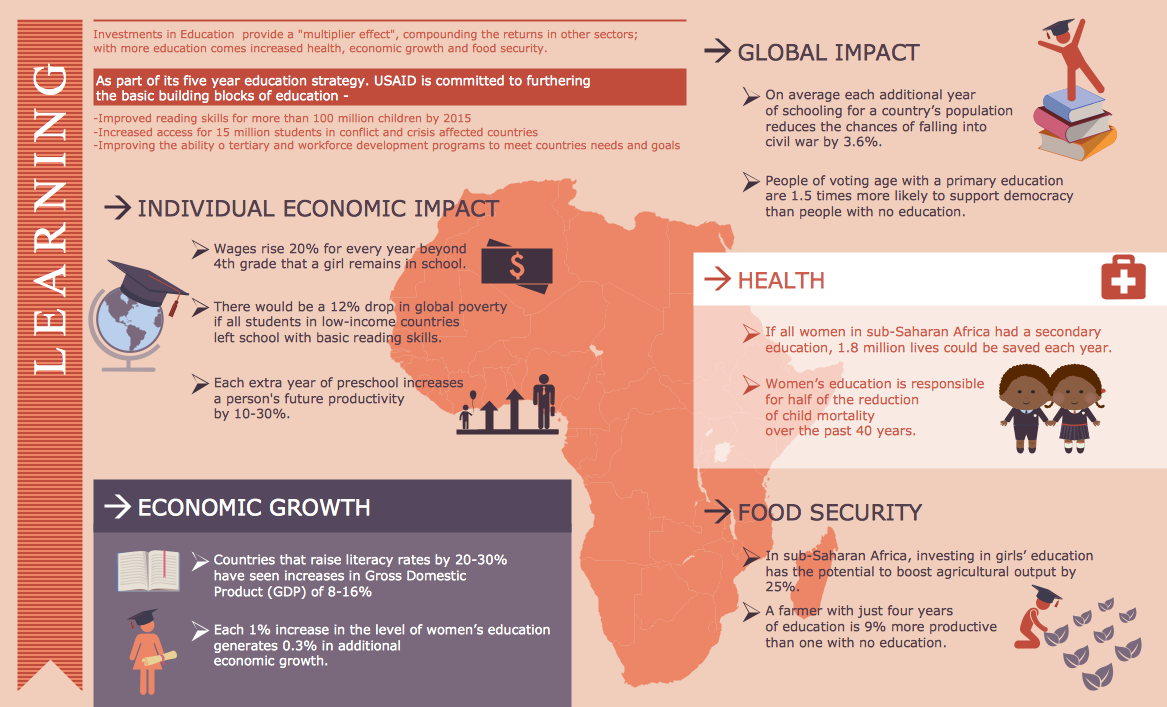
Education Infographics
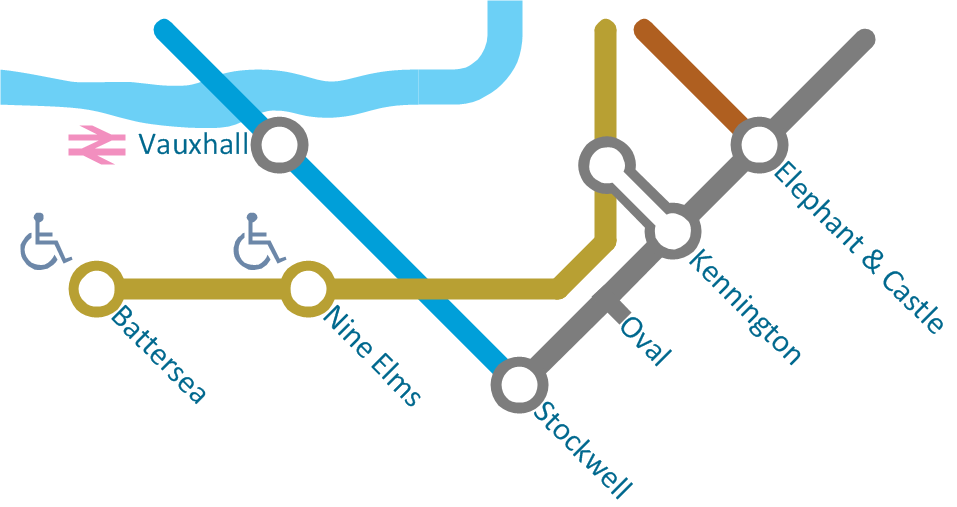
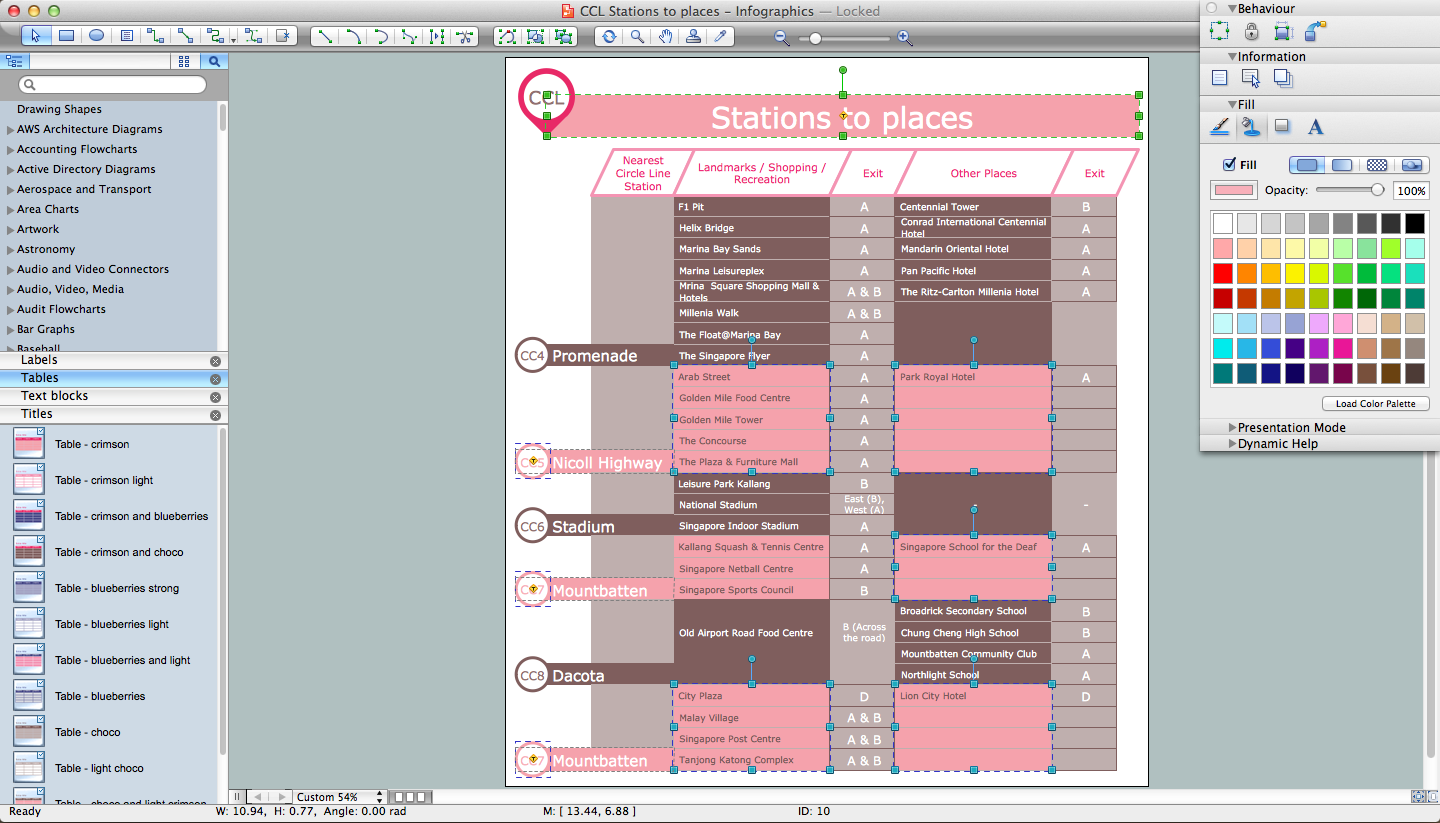
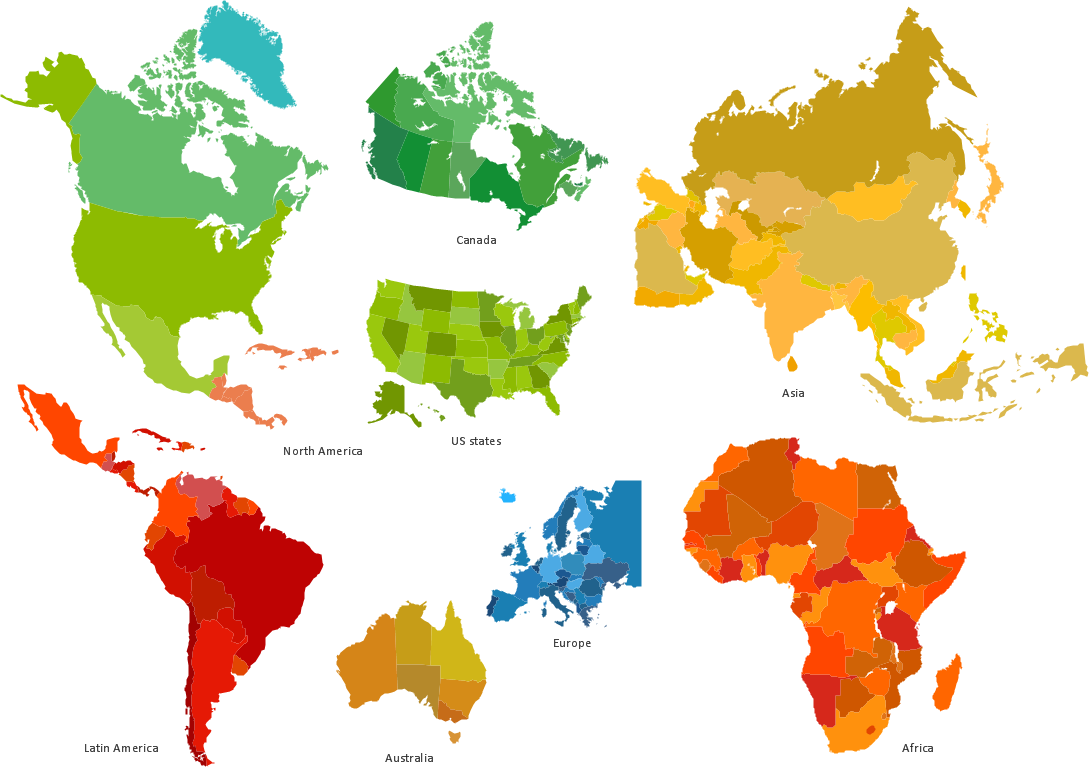
Spatial infographics Design Elements: Location Map
Management Consultant
A management consultant is an important person for the company, he helps in the questions of improving business performance and increasing profits, he consults for the questions of business strategy, management and financial controls, resources, and also suggests recommendations for changing the structure of the company if needed.
So, every day management consultant conduct the complex work and often use the helpful management infographics for explain his thoughts and arguments to the company direction. Thanks to the development of computer technologies, drawing of management infographics is so easy today. ConceptDraw DIAGRAM diagramming and vector drawing software offers you the Management Infographics Solution from the Business Infographics Area.
- International education | Minnesota measures - Infogram | Column ...
- Food Recipes | Food infogram - Reducing sodium | Fast food ...
- Fruit and vegetables consumption infogram | Pictures of Vegetables ...
- Marketing infogram 3 - Template | Marketing Blocking Chart ...
- Food infogram - Reducing sodium | Banquet Hall Plan Software ...
- Infographic Examples
- Infographic Template Education
- Brilliant Examples of Infographics Map, Transport, Road ...
- EU greenhouse gas emissions - Management infogram | Design ...
- World Population Infographics | Sample Pictorial Chart Sample ...