This site uses cookies. By continuing to browse the ConceptDraw site you are agreeing to our Use of Site Cookies.

Flowchart Components

The ConceptDraw Flowchart component includes a set of samples and templates. This geathered as flowchart maker toolbox which focused on drawing flowcharts of any industry standards.

Basic Diagramming

Perfect charts and graphics diagramming software with rich examples and template. ConceptDraw is ideal to draw Charts and Graphics.

Financial Trade UML Use Case Diagram Example

This sample represents the actors, use cases and dependencies between them, and also the relationships between use cases. There are used dependency and use case generalization associations on this UML diagram. Use case generalization is used when you have two similar use cases, but one of them does more than another.
This sample shows the work of the Financial Trade sphere and can be used by trading companies, commercial organizations, traders, different exchanges.

marketing diagram, marketing chart Marketing Diagrams

marketing diagram, marketing chart
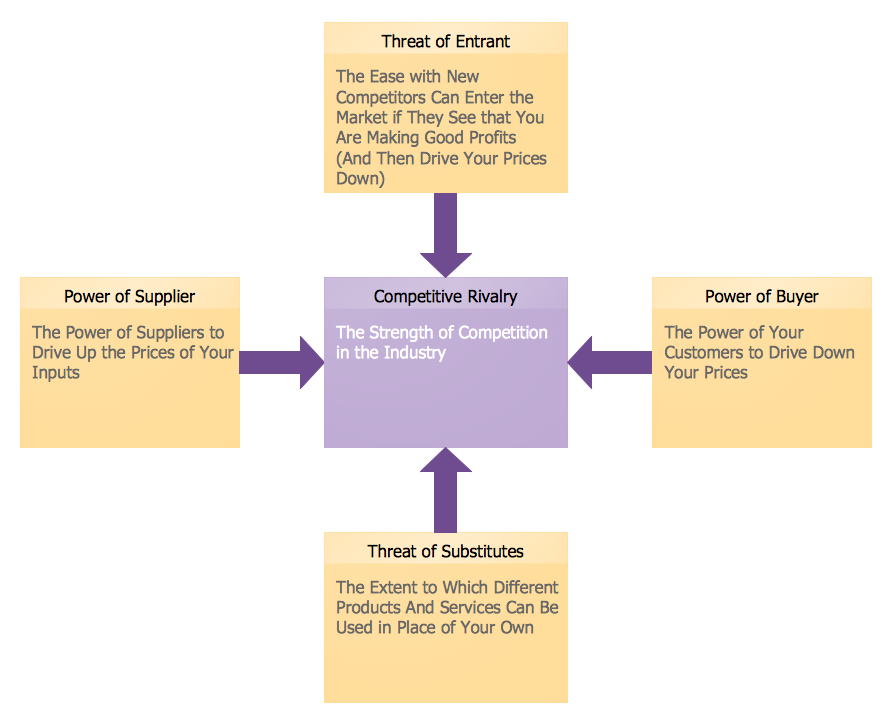
Marketing Diagrams solution extends ConceptDraw DIAGRAM diagramming software with abundance of samples, templates and vector design elements intended for easy graphical visualization and drawing different types of Marketing diagrams and graphs, including Branding Strategies Diagram, Five Forces Model Diagram, Decision Tree Diagram, Puzzle Diagram, Step Diagram, Process Chart, Strategy Map, Funnel Diagram, Value Chain Diagram, Ladder of Customer Loyalty Diagram, Leaky Bucket Diagram, Promotional Mix Diagram, Service-Goods Continuum Diagram, Six Markets Model Diagram, Sources of Customer Satisfaction Diagram, etc. Analyze effectively the marketing activity of your company and apply the optimal marketing methods with ConceptDraw DIAGRAM software.

SWOT Matrix Template

A SWOT analysis can be carried out for a product, place, industry or person. It involves specifying the objective of the business venture or project and identifying the internal and external factors that are favorable and unfavorable to achieving that objective.

SWOT matrix template

SWOT matrix templates is part of SWOT Analysis solution from ConceptDraw Solution Park.

Marketing Charts

ConceptDraw DIAGRAM diagramming and vector drawing software offers the Marketing Diagrams Solution from the Marketing Area with extensive drawing tools, predesigned vector shapes, templates and samples for fast and easy drawing marketing charts and diagrams, marketing schemes and flow charts, various marketing illustrations, etc.

SWOT Sample in Computers

The ConceptDraw is a best diagram software. The SWOT Analysis solution includes the SWOT matrix samples, and templates that allow users create own SWOT diagram.

Fishbone Diagram Example

Fishbone Diagram, also referred as Cause and Effect diagram or Ishikawa diagram, is a fault finding and problem solving tool. Construction of Ishikawa diagrams is quite complicated process and has a number of features.
Fishbone Diagrams solution included to ConceptDraw Solution Park contains powerful drawing tools and a lot of examples, samples and templates. Each Fishbone diagram example is carefully thought-out by experts and is perfect source of inspiration for you.

Fishbone Diagram Template

A causal model is an abstract concept, that describes the causal mechanisms of a system, by noting certain variables and their influence on each other, in an effort to discover the cause of a certain problem or flaw. This model is presented in diagram form by using a fishbone diagram.
ConceptDraw DIAGRAM diagramming and vector drawing software enhanced with Fishbone Diagrams solution helps you create business productivity diagrams from Fishbone diagram templates and examples, that provide to start using of the graphic method for the analysis of problem causes. Each predesigned Fishbone Diagram template is ready to use and useful for instantly drawing your own Fishbone Diagram.