How to Report Task's Execution with Gantt Chart
ConceptDraw PROJECT’s powerful reporting engine lets you generate a set of tabular reports with just one click, or visualize your project as Radial Tasks Structures, Work Breakdown Structures and Resource Calendars. It also provides you with dynamic Project Dashboards.Business Report Pie. Pie Chart Examples
This sample shows the Business Report Pie Chart. The Pie Chart visualizes the data as the proportional parts of a whole, illustrates the numerical proportion. Pie Charts are very useful in the business, statistics, analytics, mass media.Gantt chart examples
All Gantt charts were made using ConceptDraw PROJECT. ConceptDraw PROJECT works both on Windows and Mac OS X. It allows to schedule a voluntary number of projects in a single Workspace document and lets easily share tasks and resources among them. ConceptDraw PROJECT shares files among Windows and Mac OS X.Flow Chart Diagram Examples
Draw your own business process flowcharts using ConceptDraw DIAGRAM diagramming and business graphics software.Sample Project Flowchart. Flowchart Examples
This sample shows the Flowchart that displays the architecture of SQL Exception Translation. This sample was created in ConceptDraw DIAGRAM diagramming and vector drawing software using the Flowcharts solution from the Diagrams area of ConceptDraw Solution Park.
Entity Relationship Diagram Examples
Creation of Entity-Relationship (ER) model is a visual representation the structure of a business database, where data equates to entities or objects, which are linked by defined relationships expressing dependencies and requirements. By the nature, the ER model is an abstract visualization, a first step in design process towards creating a logical and functional database. ConceptDraw DIAGRAM professional software gives the ability to effectively describe a database using the Entity-Relationship model. Included to ConceptDraw Solution Park, the Entity-Relationship Diagram (ERD) solution contains the set of predesigned vector icons advocated by Chen's and Crow’s Foot notations that both can be used for data modeling and describing a database. Entity-Relationship Diagram (ERD) solution includes also helpful templates and incredibly large collection of varied Entity Relationship Diagram examples and samples offered at ConceptDraw STORE. Each of them can be used to develop your own model of a database of arbitrary complexity.
Swot Analysis Examples
SWOT analysis is an advanced plan making methodology for detection the Strengths and Weaknesses, Opportunities and Threats, that are involved in a project. SWOT analysis possesses a wide variety of real and potential applications and is a key part of any business planning and analysis. SWOT analysis uses as a visual tool the SWOT diagrams and SWOT matrices. ConceptDraw DIAGRAM software with SWOT and TOWS Matrix Diagrams solution provides a lot of SWOT analysis examples and samples, and also numerous collection of built-in SWOT templates, which will be the good start in your self-depending drawing and the perfect source of inspiration. You can always start to design your SWOT diagrams from the blank sheet using the included predesigned vector objects, but in many cases to save the time and efforts for SWOT diagramming would be preferable to use the ready example the most appropriate to your needs. Customizing the proposed SWOT diagrams you will achieve a great success in drawing SWOT matrices of any style and complexity.Communication Tool for Remote Project Management
Communication is the main challenge and the key success factor for remote project management. Communicating visually via Skype you bring all team and customers onto the one page. Remote Presentation for Skype solution for ConceptDraw MINDMAP helps communicate with remote team and customers in visual manner on wide range of issues. Using this solution for regular status meetings allows you to push your team on tasks and keep task statuses up to date.Network Diagram Examples
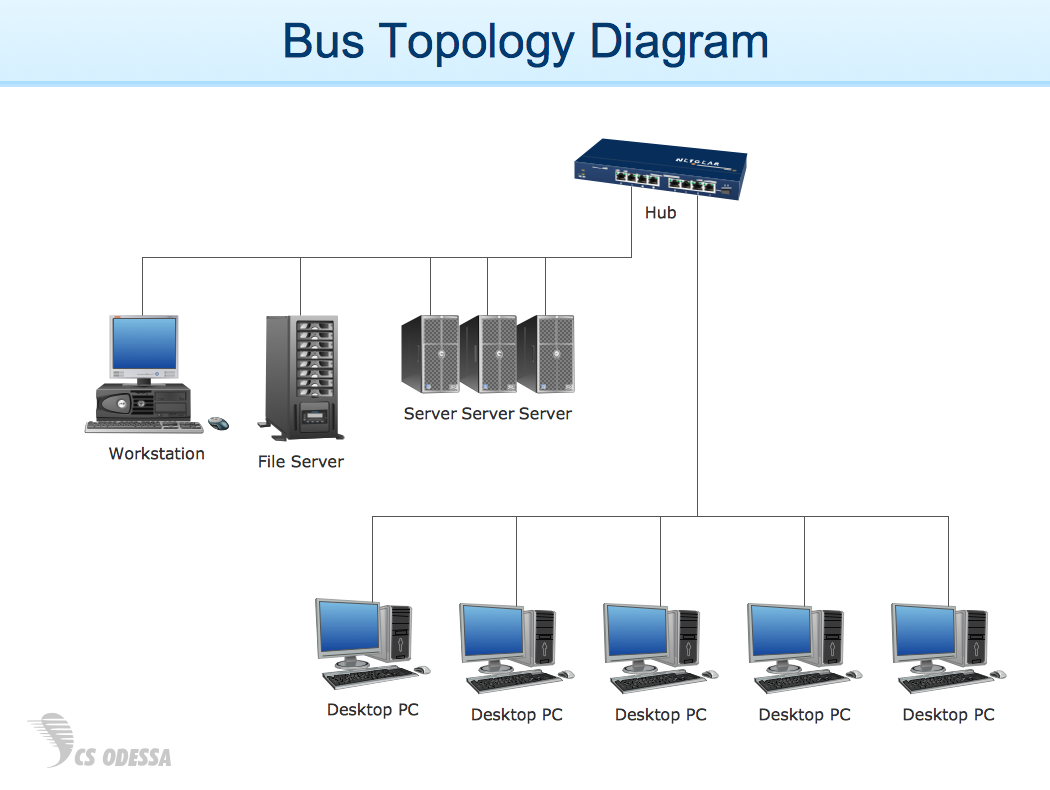
Network diagram is a chart which represents nodes and connections between them in computer network or any telecommunication network, it is a visual depiction of network architecture, physical or logical network topology. There are used common icons for the Network diagrams design, such as icons of various network appliances, computer devices, routers, clouds, peripheral devices, digital devices, etc. Network diagrams can represent networks of different scales (LAN level, WAN level) and detailization. ConceptDraw DIAGRAM diagramming software enhanced with Computer Network Diagrams solution from Computer and Networks area includes huge collection of computer and network templates, design objects and stencils, and numerous quantity of Network diagram examples and samples, among them: Basic Computer Network Diagrams, Communication Network Diagram, Wireless Router Network Diagram, LAN Topology Diagram, Computer Network System Design Diagram, Mobile Satellite Communication Network, Web-based Network Diagram, Hybrid Network Diagram, and many others.
Presenting Documents with Skype
Presentation tools. A convenient tool to present documents via Skype. Share your desktop, collaborate on documents in real-time and run a web conference one-on-one or one-to-many. A tool for sharing and presenting business documents via Skype. Allows to present Microsoft® Word®, Microsoft PowerPoint®, Microsoft Project® and plenty mindmapping formats.
- Network Diagram Examples | Report Writing On Lan Project Sample
- How To Create Project Report | Cross Functional Flowchart ...
- Gantt Chart Project Reports
- Entity-Relationship Diagram (ERD) | How To Create Project Report ...
- Reporting Flow Chart Template
- Sample Project Flowchart. Flowchart Examples | Flowchart ...
- Marketing Analysis Diagram | Flowchart Example : Flow Chart of ...
- Report Writing Simple Flow Chart
- Sales Growth. Bar Graphs Example | Business Report Pie. Pie Chart ...
- Gantt chart examples | Gant Chart in Project Management | How to ...


