This site uses cookies. By continuing to browse the ConceptDraw site you are agreeing to our Use of Site Cookies.

Work Flow Process Chart

Workflow Diagram - workflow process diagram is a visual representation of a organizational process flow. Often it used as the same visual notation as process flow diagram. Visualising business processes using workflow diagram (workflow process diagram) allows estimate business process efficiency, analyse and optimize the process itself. Workflow diagram helps get focusing on each step and relations between workflow steps. ConceptDraw PRO is software for making workflow diagram. It contains specific designed graphics to draw workflow diagrams effectively. This is workflow diagram maker which do your work process effective.

Flow Chart Design - How to Design a Good Flowchart

Use ConceptDraw PRO business diagramming and business graphics software for general diagramming purposes, it inludes tousands colored professional flowchart symbols, examples and samples which saves time when you prepare documents, professional presentations or make an explanation of process flow diagram.

Process Flowchart

ConceptDraw is Professional business process mapping software for making process flow diagram, workflow diagram, general flowcharts and technical illustrations for business documents. It is includes rich examples, templates, process flowchart symbols. ConceptDraw flowchart maker allows you to easier create a process flowchart. Use a variety of drawing tools, smart connectors, flowchart symbols and shape libraries to create flowcharts of complex processes, process flow diagrams, procedures and information exchange.
How To Create a Process Flow Chart (business process modelling techniques)

Work Flow Chart

What is a Work Flow Chart? It is a chart which visually displays the step-by-step transferring of data, documents and tasks during the work. ConceptDraw PRO extended with Workflow Diagrams solution from the Business Processes area of ConceptDraw Solution Park is the best software for drawing the Work Flow Chart of any complexity.

Create Workflow Diagram

In any unclear situation create a workflow diagram. Workflow diagrams help to understand processes, find bottlenecks and fix the process. When you create workflow diagram using ConceptDraw PRO software you are able to focus on thinking, not drawing, that makes you as effective as possible.

Drawing Workflow Diagrams

Drawing workflow diagrams combines both creative and analytic practice. To be the most effective in this process you should find a software that suites this kind of practice. Using ConceptDraw PRO software for drawing workflow diagrams you get support of features, libraries, templates and samples boosts you creativity and keep you focus on analytic practice, not drawing specifics.

Gant Chart in Project Management

Gant Chart is a graphical representation of tasks as segments on a time scale. It helps plan and monitor project development or resource allocation. The horizontal axis is a time scale, expressed either in absolute or relative time.
what is software project management

How to Create a Cross Functional Flow Chart

If neither of 45 vector shapes of the Cross-Functional Flowcharts solution don't fit your needs, you will want to learn How to create a unique Cross-Functional flowchart.

ConceptDraw Arrows10 Technology - This is more than enough versatility to draw any type of diagram with any degree of complexity.

Drawing software lets you to make horizontal and vertical, audit, opportunity and many more flowcharts.

How to Draw an Organization Chart

How to Draw an Organization Chart - The innovative ConceptDraw Arrows10 Technology included in ConceptDraw PRO is a powerful drawing tool that changes the way diagrams are produced.
While making the drawing process easier and faster.
Video tutorial on creating orgchart with ConceptDraw products. Try ConceptDraw for creating orgchart professional presentations!
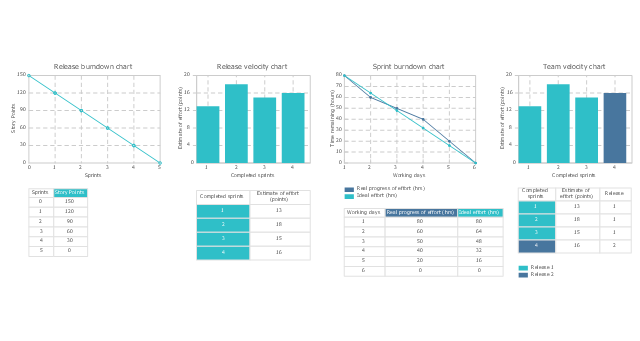
The vector stencils library "Scrum charts" contains 4 templates: release burndown chart, sprint burndown chart, release velocity chart and team velocity chart. Use it to design your agile software development charts and infographics.
"A burn down chart is a graphical representation of work left to do versus time. The outstanding work (or backlog) is often on the vertical axis, with time along the horizontal. That is, it is a run chart of outstanding work. It is useful for predicting when all of the work will be completed. It is often used in agile software development methodologies such as Scrum. However, burn down charts can be applied to any project containing measurable progress over time.
Outstanding work can be represented in terms of either time or story points." [Burn down chart. Wikipedia]
The burn down and velocity charts sample "Design elements - Scrum charts" is included in the Scrum solution from the Project Management area of ConceptDraw Solution Park.
Burn down and velocity charts
Burn down and velocity charts, team velocity chart, sprint burndown chart, release velocity chart, release burndown chart,