Martin ERD Diagram

"An ER model is an abstract way of describing a database. In the case of a relational database, which stores data in tables, some of the data in these tables point to data in other tables - for instance, your entry in the database could point to several entries for each of the phone numbers that are yours. The ER model would say that you are an entity, and each phone number is an entity, and the relationship between you and the phone numbers is 'has a phone number'. Diagrams created to design these entities and relationships are called entity–relationship diagrams or ER diagrams.
Using the three schema approach to software engineering, there are three levels of ER models that may be developed. ...
Conceptual data model ... is the highest level ER model in that it contains the least granular detail but establishes the overall scope of what is to be included within the model set.
Logical ER model ... contains more detail than the conceptual ER model. In addition to master data entities, operational and transactional data entities are now defined.
The physical ER model is normally developed to be instantiated as a database. Therefore, each physical ER model must contain enough detail to produce a database and each physical ER model is technology dependent since each database management system is somewhat different.
Physical model ... is normally forward engineered to instantiate the structural metadata into a database management system as relational database objects such as database tables, database indexes such as unique key indexes, and database constraints such as a foreign key constraint or a commonality constraint." [Entity–relationship model. Wikipedia]
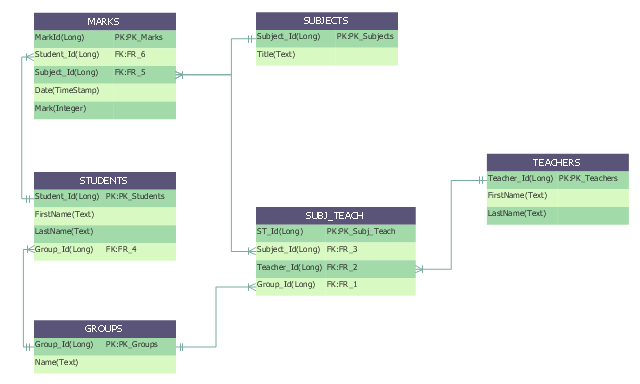
This crow's foot entity-relationship diagram (ERD) example "Educational data base" was created using the ConceptDraw PRO diagramming and vector drawing software extended with the Entity-Relationship Diagram (ERD) solution from the Software Development area of ConceptDraw Solution Park.
Using the three schema approach to software engineering, there are three levels of ER models that may be developed. ...
Conceptual data model ... is the highest level ER model in that it contains the least granular detail but establishes the overall scope of what is to be included within the model set.
Logical ER model ... contains more detail than the conceptual ER model. In addition to master data entities, operational and transactional data entities are now defined.
The physical ER model is normally developed to be instantiated as a database. Therefore, each physical ER model must contain enough detail to produce a database and each physical ER model is technology dependent since each database management system is somewhat different.
Physical model ... is normally forward engineered to instantiate the structural metadata into a database management system as relational database objects such as database tables, database indexes such as unique key indexes, and database constraints such as a foreign key constraint or a commonality constraint." [Entity–relationship model. Wikipedia]
This crow's foot entity-relationship diagram (ERD) example "Educational data base" was created using the ConceptDraw PRO diagramming and vector drawing software extended with the Entity-Relationship Diagram (ERD) solution from the Software Development area of ConceptDraw Solution Park.
ERD
Cisco Multimedia, Voice, Phone. Cisco icons, shapes, stencils and symbols
")
 Entity-Relationship Diagram (ERD)
Entity-Relationship Diagram (ERD) solution extends ConceptDraw PRO software with templates, samples and libraries of vector stencils from drawing the ER-diagrams by Chen's and crow’s foot notations.
Example of DFD for Online Store (Data Flow Diagram) DFD Example


Network Visualization with ConceptDraw PRO

 Interactive Voice Response Diagrams
Interactive Voice Response Diagrams solution extends ConceptDraw PRO v10 software with samples, templates and libraries of ready-to-use vector stencils that help create Interactive Voice Response (IVR) diagrams illustrating in details a work of interactive voice response system, the IVR system’s logical and physical structure, Voice-over-Internet Protocol (VoIP) diagrams, and Action VoIP diagrams with representing voice actions on them, to visualize how the computers interact with callers through voice recognition and dual-tone multi-frequency signaling (DTMF) keypad inputs.
Amazon Cloud

Cisco WAN. Cisco icons, shapes, stencils and symbols
")
Process Flowchart


Cloud Computing Architecture Diagrams

 Wireless Networks
The Wireless Networks Solution extends ConceptDraw PRO software with professional diagramming tools, set of wireless network diagram templates and samples, comprehensive library of wireless communications and WLAN objects to help network engineers and designers efficiently design and create Wireless network diagrams that illustrate wireless networks of any speed and complexity, and help to identify all required equipment for construction and updating wireless networks, and calculating their costs.
Architecture Diagrams

- Phone Directory ER Diagram
- Entity Relationship Diagram Of Phone Directory
- Interactive Voice Response Diagrams | Telephone Directory Er ...
- Er Diagram Of Phone Directory
- Active Directory Diagrams | Er Diagram For Phonebook System
- Active Directory Diagrams | Phone Book Erd
- ER Diagram Of Telephone Directory System
- Er Diagram For Phone Directory
- Er Digram For Phone Book Management
- Entity-Relationship Diagram ( ERD ) | Active Directory Diagrams ...
- Er Diagrams Of Telephone Directory
- Components of ER Diagram | Cisco Multimedia, Voice, Phone ...
- Components of ER Diagram | Entity-Relationship Diagram ( ERD ...
- ERD Symbols and Meanings | Design elements - ER diagram (Chen ...
- Active Directory Diagram | Active Directory Domain Services ...
- Entity-Relationship Diagram
- Design elements - ER diagram (Chen notation) | Crow's foot ERD ...
- Biology Illustration | Physics Diagrams | Mathematical Diagrams ...
- Entity Relationship Diagram - ERD - Software for Design Crows Foot ...