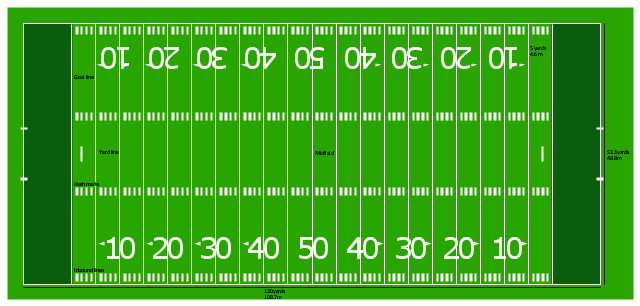
"Football games are played on a rectangular field that measures 120 yards (110 m) long and 53.33 yards (48.76 m) wide. Lines marked along the ends and sides of the field are known respectively as the end lines and side lines, and goal lines are marked 9 yards (8.2 m) outward from each end line. Weighted pylons are placed on the inside corner of the intersections of the goal lines and end lines.
White markings on the field identify the distance from the end zone. Inbound lines, or hash marks, are short parallel lines that mark off 1 yard (0.91 m) increments. Yard lines, which run the width of the field, are marked every 5 yards (4.6 m). A line one yard wide is placed at each end of the field. This line is marked at the center of the two-yard line in professional play and at the three-yard line in college play. Numerals that display the yard lines in multiples of ten are placed along both sides of the field.
Goalposts are at the center of the plane of each of the two end lines. The crossbar of these posts is ten feet (3 meters) above the ground, with vertical uprights at the end of the crossbar 18 feet 6 inches (6 m) apart for professional and collegiate play and 23 feet 4 inches (7 m) apart for high school play. The uprights extend vertically 10 yards on professional fields, a minimum of 10 yards on college fields, and a minimum of ten feet on high school fields. Goal posts are padded at the base, and orange ribbons are normally placed at the tip of each upright." [American football. Wikipedia]
The diagram example "Horizontal colored football field" was created using the ConceptDraw PRO diagramming and vector drawing software extended with the Football solution from the Sport area of ConceptDraw Solution Park.
American football field diagram
How to Create a Line Chart

Horizontal Cross Functional Flowchart

ERD Symbols and Meanings


The vector stencils library "Mac OS X Lion user interface" contains 52 UI design elements.
Use it for designing Mac OS X Lion graphic user interface (GUI) of software for Apple computers in the ConceptDraw PRO diagramming and vector drawing software extended with the Graphic User Interface solution from the Software Development area of ConceptDraw Solution Park.
Use it for designing Mac OS X Lion graphic user interface (GUI) of software for Apple computers in the ConceptDraw PRO diagramming and vector drawing software extended with the Graphic User Interface solution from the Software Development area of ConceptDraw Solution Park.
Title Bar

Title Bar Inactive

Window

Window Inactive

Window Title Bar

Window Title Bar (Inactive)
-mac-os-x-lion-user-interface---vector-stencils-library.png--diagram-flowchart-example.png)
Full Screen Button

Exit Full Screen Button

Window without Bar

Window (Narrow Toolbar)
-mac-os-x-lion-user-interface---vector-stencils-library.png--diagram-flowchart-example.png)
Window Inactive (Narrow Toolbar)
-mac-os-x-lion-user-interface---vector-stencils-library.png--diagram-flowchart-example.png)
Panel (Hud Window)
-mac-os-x-lion-user-interface---vector-stencils-library.png--diagram-flowchart-example.png)
Panel (Hud Window) (Inactive)
-(inactive)-mac-os-x-lion-user-interface---vector-stencils-library.png--diagram-flowchart-example.png)
Box 1

Box 2

Field

List View 1

List View 2

Scroll Bar Vertical

Scroll Bar Horizontal

Main Menu

Menu Bar

Menu

Vertical Line

Horizontal Line

Apple Menu

Arrow mark
Combo Box

Pop Up Menu

Text Field

Count Button

Search Field

Check Box

Check Box

Group of Check Boxes

Radio Button

Radio Button

Group of Radio Buttons

Linear Slider (round thumb)
-mac-os-x-lion-user-interface---vector-stencils-library.png--diagram-flowchart-example.png)
Linear Slider (directional thumb)
-mac-os-x-lion-user-interface---vector-stencils-library.png--diagram-flowchart-example.png)
Circular Slider

Color Well

Relevance Indicator

Rating Indicator

Indeterminate Progress Bar

Determinate Progress Bar

Continuous Capacity Indicator

Discrete Capacity Indicator

Discrete Capacity Indicator (yellow)
-mac-os-x-lion-user-interface---vector-stencils-library.png--diagram-flowchart-example.png)
Discrete Capacity Indicator (red)
-mac-os-x-lion-user-interface---vector-stencils-library.png--diagram-flowchart-example.png)
Asynchronous Progress Indicator

Circular Progress Indicator

Chart Templates

Basic Flowchart Symbols and Meaning


How to Create a Scatter Chart

Cross-Functional Flowchart


The vector stencils library "European country flags" contains 51 clipart images of Europe state flags.
Use the European country flags clip art to illustrate your business documents, presentation slides, web pages, geo maps and infographics.
The clip art example "European country flags - Vector stencils library" was created using the ConceptDraw PRO diagramming and vector drawing software extended with the Artwork solution from the Illustration area of ConceptDraw Solution Park.
Flag of Europe

Flag of Benelux
Flag of Albania

Flag of Andorra
Flag of Armenia

Flag of Austria

Flag of Azerbaijan
Flag of Belarus

Flag of Belgium

Flag of Bosnia and Herzegovina

Flag of Bulgaria
Flag of Croatia
Flag of Cyprus
Flag of Czech Republic
Flag of Denmark
Flag of Estonia
Flag of Finland
Flag of France
Flag of Georgia
Flag of Germany

Flag of Greece

Flag of Hungary

Flag of Iceland
Flag of Ireland
Flag of Italy

Flag of Kazakhstan

Flag of Latvia

Flag of Liechtenstein

Flag of Lithuania

Flag of Luxembourg

Flag of the Republic of Macedonia
Flag of Malta
Flag of Moldova
Flag of Monaco

Flag of Montenegro
Flag of the Netherlands

Flag of Norway
Flag of Poland

Flag of Portugal
Flag of Romania

Flag of Russia
Flag of San Marino
Flag of Serbia
Flag of Slovakia

Flag of Slovenia
Flag of Spain
Flag of Sweden
Flag of Switzerland

Flag of Turkey
Flag of Ukraine

Flag of the United Kingdom
- White Line Vertical Png
- Horizontal White Line Png
- White Black Line Background
- Horizontal Line With Down Arrow Png
- Horizontal colored football field | Association football (soccer) field ...
- (Football) Field
- Horizontal colored football field | Goal Line Formation (Offense ...
- Slider Arrow Png
- Soccer (Football) Dimensions | Horizontal colored football field ...