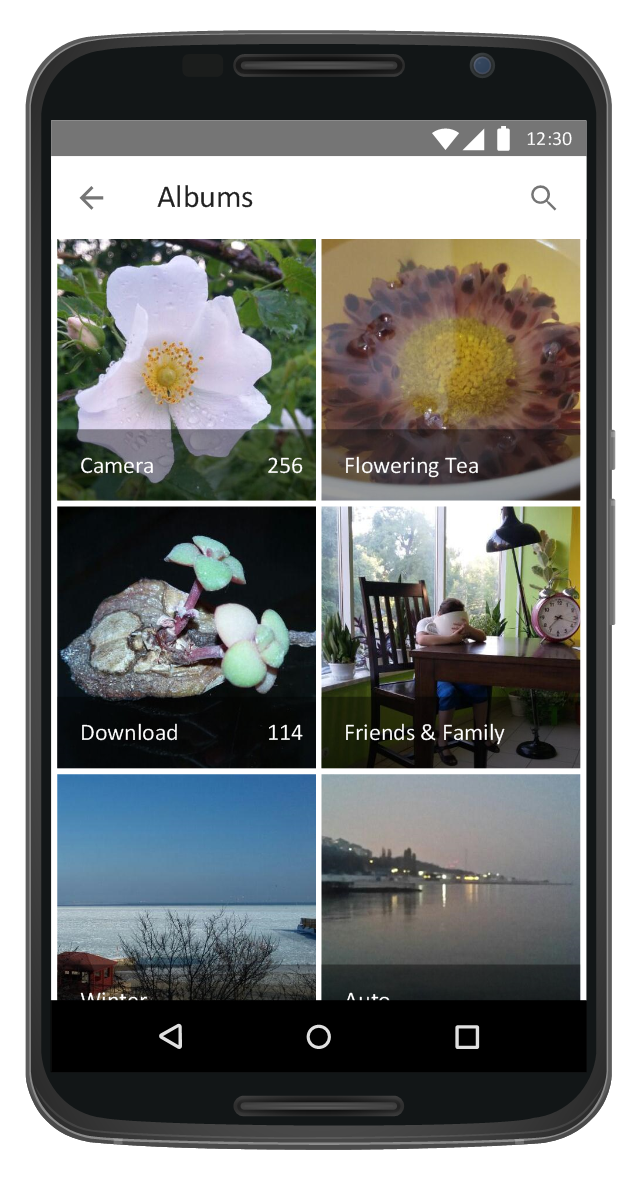
This Android 7 user interface example illustrates usage of Android Material Design single-line grid list.
"Grid lists are an alternative to standard list views.
A grid list consists of a repeated pattern of cells arrayed in a vertical and horizontal layout.
Grid lists are best used on similar data types. They help improve the visual comprehension of the content they contain. ...
A grid list is best suited to presenting homogenous data, typically images, and is optimized for visual comprehension and differentiating between similar data types. ...
A grid list consists of a repeated pattern of cells arrayed vertically and horizontally within the grid list.
Tiles hold content and can span one or more cells vertically or horizontally." [material.io/ guidelines/ components/ grid-lists.html]
The Android 7 UI design example "Single-line grid list" was created using the ConceptDraw PRO diagramming and vector drawing software extended with the "Android user interface" solution from the "Software Development" area of ConceptDraw Solution Park.
Single-line grid list
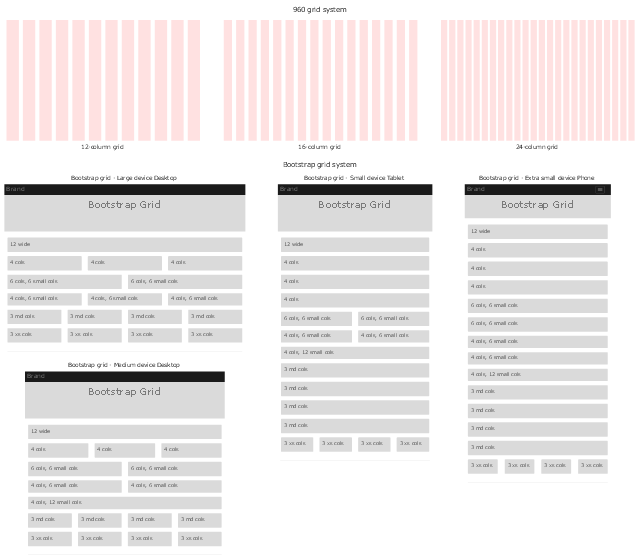
The vector stencils library "Wireframe grid" contains 7 web page layout design patterns.
Use these grids to position content and widgets on your web pages using the ConceptDraw PRO diagramming and vector drawing software.
"In graphic design, a grid is a structure (usually two-dimensional) made up of a series of intersecting straight (vertical, horizontal, and angular) or curved guide lines used to structure content. The grid serves as an armature on which a designer can organize graphic elements (images, glyphs, paragraphs) in a rational, easy to absorb manner. A grid can be used to organize graphic elements in relation to a page, in relation to other graphic elements on the page, or relation to other parts of the same graphic element or shape. ...
While grid systems have seen significant use in print media, interest from web developers has only recently seen a resurgence. Website design frameworks producing HTML and CSS had existed for a while before newer frameworks popularised the use of grid-based layouts. Some grid systems specify fixed-width elements with pixels, and some are 'fluid', meaning that they call for page element sizing to be in relative units like percentages, rather than absolute units like pixels or points." [en.wikipedia.org/ wiki/ Grid_ (graphic_ design)]
The webpage layout patterns example "Design elements - Wireframe grid" is included in the Website Mockup solution from the Software Development area of ConceptDraw Solution Park.
Website wireframe design elements
ConceptDraw Arrows10 Technology

Bar Chart Software

Product Overview

"A chart can take a large variety of forms, however there are common features that provide the chart with its ability to extract meaning from data.
Typically the data in a chart is represented graphically, since humans are generally able to infer meaning from pictures quicker than from text. Text is generally used only to annotate the data.
One of the more important uses of text in a graph is the title. A graph's title usually appears above the main graphic and provides a succinct description of what the data in the graph refers to.
Dimensions in the data are often displayed on axes. If a horizontal and a vertical axis are used, they are usually referred to as the x-axis and y-axis respectively. Each axis will have a scale, denoted by periodic graduations and usually accompanied by numerical or categorical indications. Each axis will typically also have a label displayed outside or beside it, briefly describing the dimension represented. If the scale is numerical, the label will often be suffixed with the unit of that scale in parentheses. ...
Within the graph a grid of lines may appear to aid in the visual alignment of data. The grid can be enhanced by visually emphasizing the lines at regular or significant graduations. The emphasized lines are then called major grid lines and the remainder are minor grid lines.
The data of a chart can appear in all manner of formats, and may include individual textual labels describing the datum associated with the indicated position in the chart. The data may appear as dots or shapes, connected or unconnected, and in any combination of colors and patterns. Inferences or points of interest can be overlaid directly on the graph to further aid information extraction.
When the data appearing in a chart contains multiple variables, the chart may include a legend (also known as a key). A legend contains a list of the variables appearing in the chart and an example of their appearance. This information allows the data from each variable to be identified in the chart." [Chart. Wikipedia]
The vector stencils library "Time series charts" contains 10 templates: 3 column charts, 3 bar charts, 2 line graphs and 2 dot plots. All these charts are Live Objects displaying the data from external data source files.
Use these chart templates to design your business performance digital dashboards using the ConceptDraw PRO diagramming and vector drawing software.
The example "Design elements - Time series charts" is included in the Time Series Dashboard solution from the area "What is a Dashboard" of ConceptDraw Solution Park.
Time series charts

Cross-Functional Flowchart


Types of Flowcharts


 Website Wireframe
The innovative Website Wireframe solution enhances the ConceptDraw PRO v10 functionality with newest wireframe tools, libraries with variety of predesigned icons, symbols, buttons, graphics, forms, boxes, and many other vector elements, templates and professionally designed samples, which make it the best wireframing software. Website Wireframe solution gives you significant advantages when designing and maintaining websites, creating skeletal and content-free depictions of website structure, making website prototypes and planning the content arrangement before committing to design, also speeds up the processes of sketching, producing and sharing wireframe examples of website style and interface design.
How to Create a Line Chart

- Website Wireframe | Single-line grid list | ConceptDraw Arrows10 ...
- Design elements - Android grids | Single-line grid list | Android User ...
- Grid Network Topology | Grid computing system architecture ...
- Single-line grid list | Android User Interface | Design elements ...
- Matrix Organization Structure | Chart Maker for Presentations ...
- Android 5.0 - Single-line list | Single-line grid list | Status Dashboard ...
- Matrix Organization Structure | Wireframe Tools | Column Chart ...
- Android 5.0 - Single-line list | Single-line grid list | Design elements ...
- Android 5.0 - Single-line list | Single-line grid list | Android User ...
- Design elements - Android grids | Android User Interface | Design ...