Process Flow Chart

Types of Flowcharts


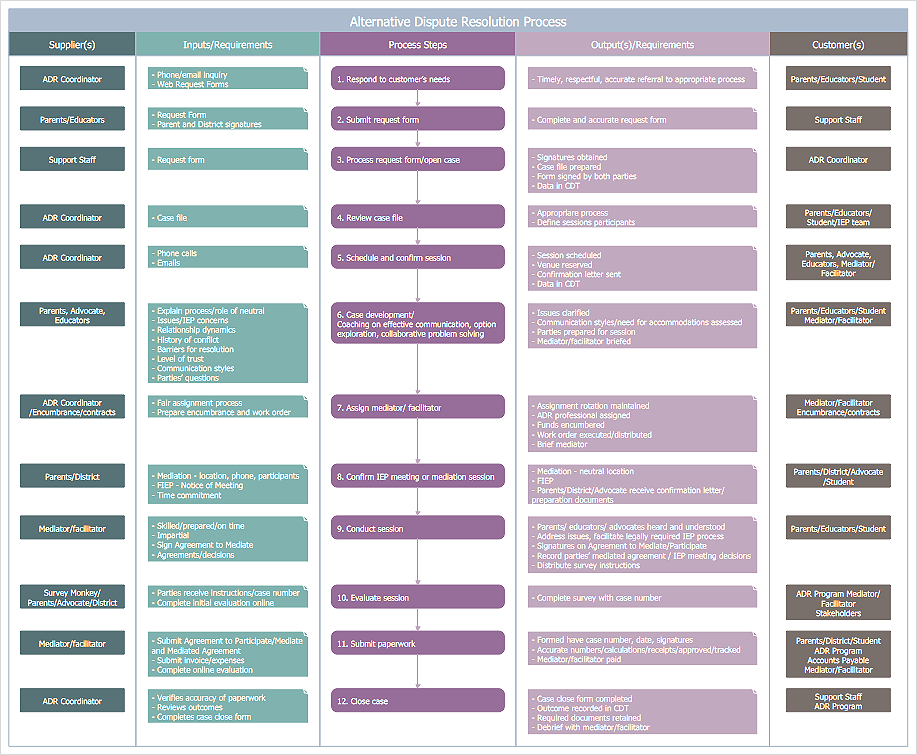
Cross-Functional Flowchart


 Business Process Mapping
The Business Process Mapping solution for ConceptDraw DIAGRAM is for users involved in process mapping and creating SIPOC diagrams.
HelpDesk
How to Create a SIPOC Diagram
Process Flow Maps

Data Flow Diagram

Technical Flow Chart

Flowchart Definition

- Level 3 Process Map
- Flowcharts | Business Process Mapping | High Level Language ...
- Process Mapping Levels Definition
- High Level Process Flow
- High Level Process Map Template
- High Level Flowchart Examples
- CS Odessa Releases a Paid Business Process Mapping Solution for ...
- Basic Flowchart Symbols and Meaning | Process Flowchart ...
- High Level As Is Process Flow Chart