Sales Growth. Bar Graphs Example

The vector stencils library "Finance" contains 16 finance icons.
Use it to design your financial computing and telecom illustrations and infographics with ConceptDraw PRO diagramming and vector drawing software.
The vector stencils library "Finance" is included in the Computers and Communications solution from the Illustration area of ConceptDraw Solution Park.
Use it to design your financial computing and telecom illustrations and infographics with ConceptDraw PRO diagramming and vector drawing software.
The vector stencils library "Finance" is included in the Computers and Communications solution from the Illustration area of ConceptDraw Solution Park.
Growth chart

Currency

Credit cards

Finance planning

Funds

Bank storage

Safe box

Bank

Transaction

Accounting

Send money

Receive money

Wallet

Marketplace

Case

Award

This pictorial chart sample shows the population growth by continent in 2010-2013.
"Population growth' refers to the growth in human populations. Global population growth is around 80 million annually, or 1.2% p.a. The global population has grown from 1 billion in 1800 to 7 billion in 2012. It is expected to keep growing to reach 11 billion by the end of the century. Most of the growth occurs in the nations with the most poverty, showing the direct link between high population growth and low standards of living. The nations with high standards of living generally have low or zero rates of population growth. Australia's population growth is around 400,000 annually, or 1.8% p.a., which is nearly double the global average. It is caused mainly by very high immigration of around 200,000 p.a., the highest immigration rate in the world. Australia remains the only nation in the world with both high population growth and high standards of living." [Population growth. Wikipedia]
The image chart example "Population growth by continent, 2010 - 2013" was created using the ConceptDraw PRO diagramming and vector drawing software extended with the Basic Picture Graphs solution from the Graphs and Charts area of ConceptDraw Solution Park.
Image chart

The vector stencils library "Finance" contains 16 finance icons.
Use it to design your financial computing and telecom illustrations and infographics with ConceptDraw PRO diagramming and vector drawing software.
The vector stencils library "Finance" is included in the Computers and Communications solution from the Illustration area of ConceptDraw Solution Park.
Use it to design your financial computing and telecom illustrations and infographics with ConceptDraw PRO diagramming and vector drawing software.
The vector stencils library "Finance" is included in the Computers and Communications solution from the Illustration area of ConceptDraw Solution Park.
Growth chart
Currency
Credit cards
Finance planning
Funds
Bank storage
Safe box
Bank
Transaction
Accounting
Send money
Receive money
Wallet
Marketplace
Case
Award
Growth-Share Matrix Software

This area chart sample shows the population growth of San Francisco, California from 1850-2005. It was redesigned from the Wikimedia Commons file: San Francisco CA Population Growth.svg. [commons.wikimedia.org/ wiki/ File:San_ Francisco_ CA_ Population_ Growth.svg]
"The San Francisco Bay Area, commonly known as the Bay Area, is a populated region that surrounds the San Francisco and San Pablo estuaries in Northern California, United States. The region encompasses the major cities and metropolitan areas of San Francisco, Oakland, and San Jose, along with smaller urban and rural areas. The Bay Area's nine counties are Alameda, Contra Costa, Marin, Napa, San Francisco, San Mateo, Santa Clara, Solano, and Sonoma. Home to approximately 7.44 million people, the nine-county Bay Area contains many cities, towns, airports, and associated regional, state, and national parks, connected by a network of roads, highways, railroads, bridges, tunnels and commuter rail. The combined urban area of San Francisco and San Jose is the second largest in California (after the Greater Los Angeles area), the fifth largest in the United States, and the 56th largest urban area in the world." [San Francisco Bay Area. Wikipedia]
The area graph example "San Francisco CA Population Growth" was created using the ConceptDraw PRO diagramming and vector drawing software extended with the Area Charts solution from the Graphs and Charts area of ConceptDraw Solution Park.
Area chart

This picture bar graph sample shows regional population growth from 2010 to 2016. It was designed using data from the Wikipedia article List of continents by population.
[en.wikipedia.org/ wiki/ List_ of_ continents_ by_ population]
"Population geography is a division of human geography. It is the study of the ways in which spatial variations in the distribution, composition, migration, and growth of populations are related to the nature of places. Population geography involves demography in a geographical perspective. It focuses on the characteristics of population distributions that change in a spatial context." [Population geography. Wikipedia]
The pictorial chart example "Regional population growth from 2010 to 2016" was created using the ConceptDraw PRO diagramming and vector drawing software extended with the Picture Graphs solution from the Graphs and Charts area of ConceptDraw Solution Park.
Image chart

Basic Diagramming


Percentage Pie Chart. Pie Chart Examples

Column Chart Examples

Pyramid Diagram

Bar Chart Examples

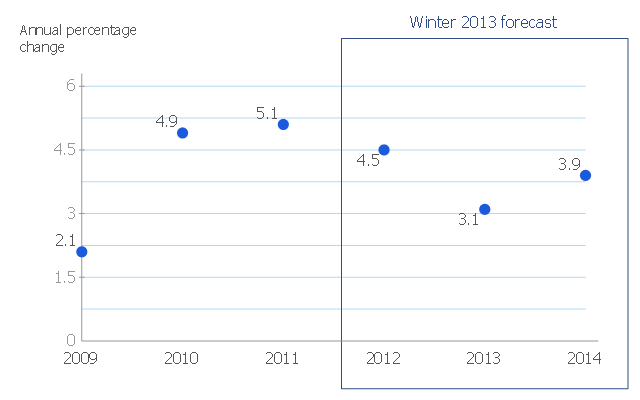
This scatter chart sample shows the MENA's (Middle East and North Africa's) real GDP growth. It was designed on the base scatter graph from the website of the European Economic Forecast (EUROPEAN ECONOMY 1|2013, Economic and Financial Affairs Winter 2013, European Commission). [ec.europa.eu/ economy_ finance/ publications/ european_ economy/ 2013/ pdf/ ee1_ en.pdf]
"The term MENA, for "Middle East and North Africa", is an acronym often used in academic, military planning, disaster relief, and business writing.
Due to the geographic ambiguity and Eurocentric nature of the term "Middle East", many people prefer use of the term WANA (West Asia and North Africa) or the less common NAWA (North Africa-West Asia).
The term covers an extensive region, extending from Morocco to Iran, including the majority of both the Middle Eastern and Maghreb countries. The term is roughly synonymous with the term the Greater Middle East. ...
MENA has no standardized definition; different organizations define the region as consisting of different territories. The following is a list of commonly included countries and territories: Bahrain, Egypt, Iran, Iraq, Israel, Jordan, Kuwait, Lebanon, Yemen, United Arab Emirates, Libya, Morocco, Oman, West Bank and Gaza, Qatar, Saudi Arabia, Syria, Tunisia, Algeria.
Sometimes also included in broader definitions: Armenia, Azerbaijan, Cyprus, Djibouti, Mauritania, Somalia, Sudan, Turkey, Western Sahara." [MENA. Wikipedia]
The scatter chart example "Middle East and North Africa's real GDP growth" was created using the ConceptDraw PRO diagramming and vector drawing software extended with the Line Graphs solution from the Graphs and Charts area of ConceptDraw Solution Park.
Scatter graph
Bar Chart Template for Word

Chart Maker for Presentations

- Growth Chart Png
- Sales Growth . Bar Graphs Example | Bar Chart Template for Word ...
- Business Growth Chart Template
- Sales Growth . Bar Graphs Example | Bar Chart Examples | Business ...
- Sales Growth . Bar Graphs Example | Chart Maker for Presentations ...
- Business Growth Chart Graph
- Sales Growth Chart
- Bar Chart Template for Word | Financial Comparison Chart | Sales ...
- Sales Growth . Bar Graphs Example | Finance - Vector stencils library ...
- Regional population growth from 2010 to 2016 | Basic Diagramming ...
- Company Growth Chart
- Business Growth Chart Image
- Create Graphs and Charts | Bar Diagrams for Problem Solving ...
- Sales Growth . Bar Graphs Example | Rainfall Bar Chart | Sales ...
- Bar Graphs | Sales Growth . Bar Graphs Example | Bar Graph | Bar ...
- Double bar chart - Nitrate concentration in Community Water ...
- Growth And Development Charts
- Chart Examples | Sales Growth . Bar Graphs Example | Business ...
- Sales Growth . Bar Graphs Example | Bar Graphs | Bar Chart ...
- Percentage Pie Chart . Pie Chart Examples | Sales Growth . Bar ...