 Picture Graphs
Typically, a Picture Graph has very broad usage. They many times used successfully in marketing, management, and manufacturing. The Picture Graphs Solution extends the capabilities of ConceptDraw PRO v10 with templates, samples, and a library of professionally developed vector stencils for designing Picture Graphs.
Chart Maker for Presentations
Easy charting software comes with beautiful chart templates and examples. This makes it easy to create professional charts without prior experience.Bar Chart
ConceptDraw PRO extended with Bar Graphs solution from Graphs and Charts area of ConceptDraw Solution Park is ideal software for quick and simple drawing bar chart of any complexity graph.Line Graph
ConceptDraw PRO extended with Line Graphs solution from Graphs and Charts area of ConceptDraw Solution Park is ideal software for quick and simple drawing professional looking line graph.How to Draw a Line Graph
In your work activity you need regularly draw the line graphs? And each time you ask yourself a question "How to Draw a Line Graph easier and faster?". The desire to automate the line graphs drawing process led to the creation of Line Graphs solution from Graphs and Charts area of ConceptDraw Solution Park.Stacked Graph
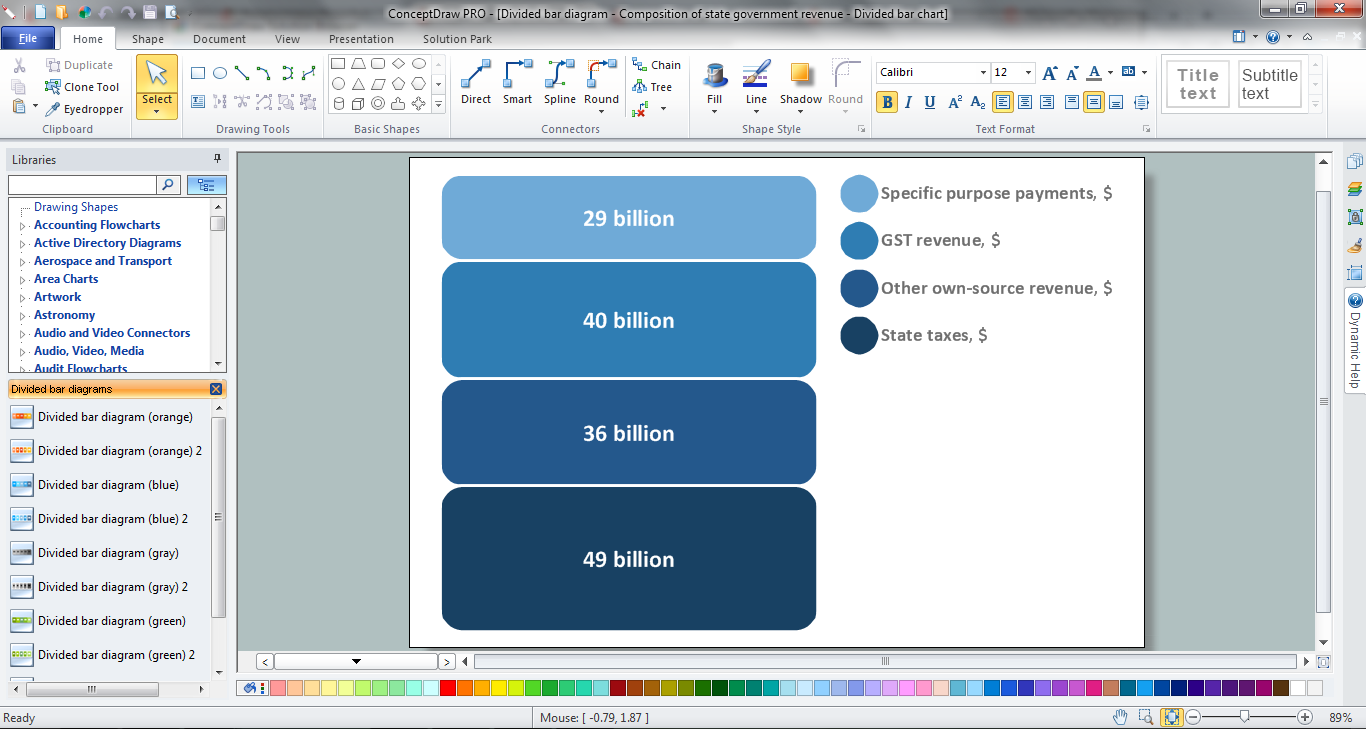
ConceptDraw PRO is a powerful software for drawing professional looking Stacked Graph thanks to the Divided Bar Diagrams solution from the Graphs and Charts area of ConceptDraw Solution Park.Rainfall Bar Chart
This sample shows the Horizontal Bar Chart of the average monthly rainfalls. This sample was created in ConceptDraw PRO diagramming and vector drawing software using the Bar Graphs Solution from the Graphs and Charts area of ConceptDraw Solution Park.Competitor Analysis
Competitor analysis is a first and obligatory step in elaboration the proper corporate marketing strategy and creating sustainable competitive advantage. Use powerful opportunities of numerous solutions from ConceptDraw Solution Park for designing illustrative diagrams, charts, matrices which are necessary for effective competitor analysis.Making a Histogram
ConceptDraw PRO is a powerful diagramming and vector drawing software. Extended with Histograms solution from the Graphs and Charts area, ConceptDraw PRO became the ideal software for making a Histogram.Bar Diagrams for Problem Solving. Create space science bar charts with Bar Graphs Solution
Bar charts represent data in different categories or groups. Create bar graphs for visual solving your scientific problems and data comparison using the ConceptDraw PRO diagramming and vector drawing software extended with the Bar Graphs Solution from the Graphs and Charts area of ConceptDraw Solition Park.Informative and Well-Designed Infographics
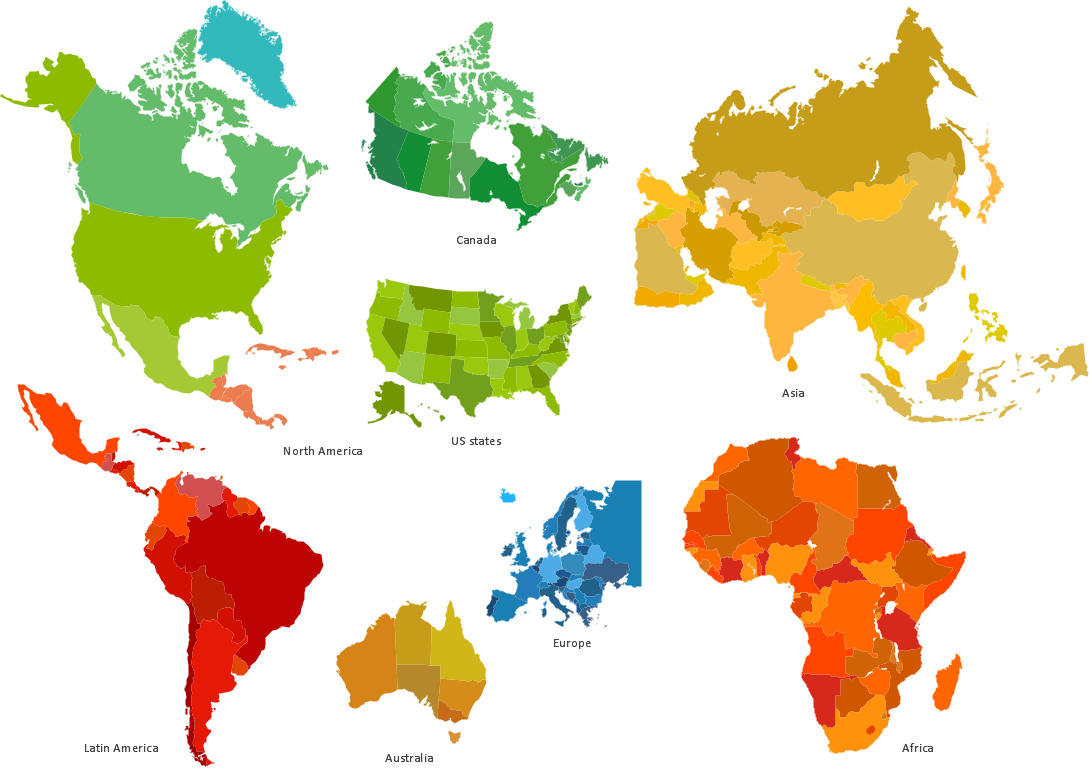
Informative and well-designed Infographics allows visually present various map containing information.
 Line Graphs
How to draw a Line Graph with ease? The Line Graphs solution extends the capabilities of ConceptDraw PRO v10 with professionally designed templates, samples, and a library of vector stencils for drawing perfect Line Graphs.
 Bar Graphs
The Bar Graphs solution enhances ConceptDraw PRO v10 functionality with templates, numerous professional-looking samples, and a library of vector stencils for drawing different types of Bar Graphs, such as Simple Bar Graph, Double Bar Graph, Divided Bar Graph, Horizontal Bar Graph, Vertical Bar Graph, and Column Bar Chart.
Bar Diagram Math
ConceptDraw PRO extended with Divided Bar Diagrams solution from Graphs and Charts area of ConceptDraw Solution Park is the best software for quick and simple drawing the Divided Bar Diagrams and Bar Diagram Math.Blank Scatter Plot
This sample shows the Scatter Plot without missing categories. It’s very important to no miss the data, because this can have the grave negative consequences. The data on the Scatter Chart are represented as points with two values of variables in the Cartesian coordinates. This sample can be used in the engineering, business, statistics, analytics, at the creating the financial and other types of reports.- Picture Graph | Picture Graphs | How to Create a Picture Graph in ...
- Graph Pic Of Ideal Solution
- Line Graph Images
- Images Of Line Graphs
- Pictures Of Line Graph
- Bar Graph Images
- Pie Graph Worksheets | Bar Graph | Chart Examples | Images Of Bar ...
- Line Graph Of Population
- Histogram | Histogram Chart | Making a Histogram | Image Histogram
- Picture Graph
- Bar Graphs | Sales Growth. Bar Graphs Example | How to Draw a ...
- Design elements - Picture bar graphs | Bar Chart | Pictures of ...
- Population growth by continent | Line Graph | Line Chart Examples ...
- What Is a Picture Graph ? | Design elements - Picture bar graphs ...
- Business Graphs And Charts Examples Image
- Line Chart Examples | Pictures of Graphs | Line Graph | Examples Of ...
- Informative and Well-Designed Infographics | Picture Graph ...
- Line Graph | Line Chart Examples | Basic Diagramming | Line Graph ...
- Picture graph - Template | Picture Graph | Chart Maker for ...


