Basic Flowchart Symbols and Meaning
Flowcharts are the best for visually representation the business processes and the flow of a custom-order process through various departments within an organization. ConceptDraw PRO diagramming and vector drawing software extended with Flowcharts solution offers the full set of predesigned basic flowchart symbols which are gathered at two libraries: Flowchart and Flowcharts Rapid Draw. Among them are: process, terminator, decision, data, document, display, manual loop, and many other specific symbols. The meaning for each symbol offered by ConceptDraw gives the presentation about their proposed use in professional Flowcharts for business and technical processes, software algorithms, well-developed structures of web sites, Workflow diagrams, Process flow diagram and correlation in developing on-line instructional projects or business process system. Use of ready flow chart symbols in diagrams is incredibly useful - you need simply drag desired from the libraries to your document and arrange them in required order. There are a few serious alternatives to Visio for Mac, one of them is ConceptDraw PRO. It is one of the main contender with the most similar features and capabilities.
Types of Flowcharts
A Flowchart is a graphical representation of process, algorithm, workflow or step-by-step solution of the problem. It shows the steps as boxes of various kinds and connects them by arrows in a defined order depicting a flow. There are twelve main Flowchart types: Basic Flowchart, Business Process Modeling Diagram (BPMN), Cross Functional Flowchart, Data Flow Diagram (DFD), IDEF (Integrated DEFinition) Flowchart, Event-driven Process Chain (EPC) Diagram, Influence Diagram (ID), Swimlane Flowchart, Process Flow Diagram (PFD), Specification and Description Language (SDL) Diagram, Value Stream Mapping, Workflow Diagram. Using the Flowcharts solution from the Diagrams area of ConceptDraw Solution Park you can easy and quickly design a Flowchart of any of these types. This solution offers a lot of special predesigned vector symbols for each of these widely used notations. They will make the drawing process of Flowcharts much easier than ever. Pay also attention for the included collection of ready Flowchart examples, samples and quick-start templates. This is business process improvement tools. If you are looking for MS Visio for your Mac, then you are out of luck, because it hasn't been released yet. However, you can use Visio alternatives that can successfully replace its functions. ConceptDraw PRO is an alternative to MS Visio for Mac that provides powerful features and intuitive user interface for the same.
ER Diagram Styles
When creating ER diagrams, you can apply different color ER diagram styles and also notation styles. ConceptDraw PRO enhanced with Entity-Relationship Diagram (ERD) Solution gives the ability to draw visual and attractive ER Diagrams using the style icons from Crow’s Foot notation and Chen's notation professionally designed and offered by ERD Chen's Notation and ERD Crow’s Foot Notation libraries.
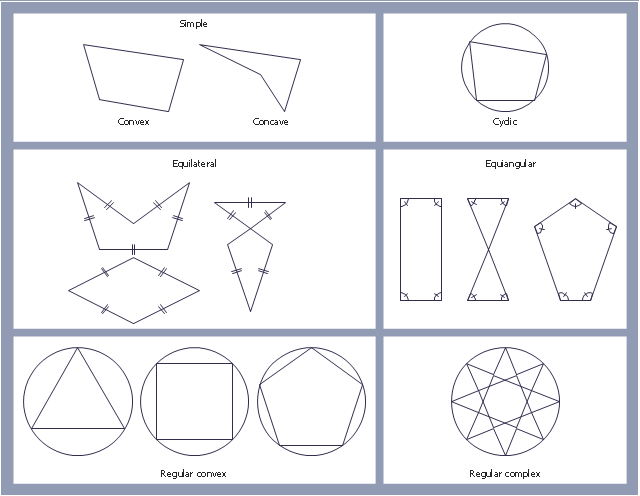
"In geometry a polygon is traditionally a plane figure that is bounded by a finite chain of straight line segments closing in a loop to form a closed chain or circuit. These segments are called its edges or sides, and the points where two edges meet are the polygon's vertices (singular: vertex) or corners. The interior of the polygon is sometimes called its body. An n-gon is a polygon with n sides. A polygon is a 2-dimensional example of the more general polytope in any number of dimensions. ...
The basic geometrical notion has been adapted in various ways to suit particular purposes. Mathematicians are often concerned only with the bounding closed polygonal chain and with simple polygons which do not self-intersect, and they often define a polygon accordingly. A polygonal boundary may be allowed to intersect itself, creating star polygons. Geometrically two edges meeting at a corner are required to form an angle that is not straight (180°); otherwise, the line segments may be considered parts of a single edge; however mathematically, such corners may sometimes be allowed. These and other generalizations of polygons are described below." [Polygon. Wikipedia]
The geometry diagram example "Polygon types" was created using the ConceptDraw PRO diagramming and vector drawing software extended with the Mathematics solution from the Science and Education area of ConceptDraw Solution Park.
The vector stencils library "Cloud shapes" contains 69 geometric shapes.
Use it to design your cloud computing diagrams and infographics with ConceptDraw PRO software.
"The essence of a diagram can be seen as: ...
- with building blocks such as geometrical shapes connected by lines, arrows, or other visual links." [Diagram. Wikipedia]
The geometric shapes example "Design elements - Cloud shapes" is included in the Cloud Computing Diagrams solution from the Computer and Networks area from ConceptDraw Solution Park.
SIPOC Diagram
SIPOC is a tool that summarizes the inputs and outputs of one or more processes in table form. You need to draw professional looking SIPOC Diagram quick and easy? Pay please your attention on ConceptDraw PRO diagramming and vector drawing software. Extended with Business Process Mapping Solution from the Business Processes Area of ConceptDraw Solution Park, it suits ideal for this.
Computer Network Diagrams
Computer Network Diagrams solution extends ConceptDraw PRO software with samples, templates and libraries of vector icons and objects of computer network devices and network components to help you create professional-looking Computer Network Diagrams, to plan simple home networks and complex computer network configurations for large buildings, to represent their schemes in a comprehensible graphical view, to document computer networks configurations, to depict the interactions between network's components, the used protocols and topologies, to represent physical and logical network structures, to compare visually different topologies and to depict their combinations, to represent in details the network structure with help of schemes, to study and analyze the network configurations, to communicate effectively to engineers, stakeholders and end-users, to track network working and troubleshoot, if necessary.
Draw Fishbone Diagram on MAC Software
The problem solving and decision-making processes are closely linked and crucial for the business and life. There are many tools and techniques for facilitating and improvement these processes, and also enhancement the quality of accepted decisions. One of them is Fisbone Diagram or Cause and Effect diagram. For its construction, you need first define the problem which you need to solve (existing or potential), write it into rectangular and draw to it a horizontal line - a “fish spine”. Then define general types of possible causes like Persons, Materials, Methods, Machinery, Measurements or Environment, and attach them to “spine”. Start brainstorming the possible reasons of failure and connect them to the branches. Professional diagramming ConceptDraw PRO MAC OSX software offers the Fishbone Diagrams solution which contains templates, samples, and ready Fishbone design objects. Use of them lets effectively identify the possible causes for an effect, realize successfully cause and effect analysis, and instantly draw Fishbone diagram on Mac software.How To Create Onion Diagram
An onion diagram is a kind of chart that shows the dependencies among parts of an organization or process. The chart displays items in concentric circles, where the items in each ring depend on the items in the smaller rings. The Onion Diagram is able to show layers of a complete system in a few circles. But how to create Onion Diagram? Now, it's very easy thanks to the ConceptDraw PRO diagramming and vector drawing software extended with Stakeholder Onion Diagrams Solution from the Management Area of ConceptDraw Solution Park.Social Media Flowchart Symbols
Social media is a popular view of mass communication which allows people, companies and organizations create, share, discover, modify, access, comment, discuss and exchange information through the Internet. Social Media Response solution for ConceptDraw PRO provides collection of 10 libraries with diversity of predesigned vector social media flowchart symbols for fast and easy creating interactive Social Media Flowcharts, Response Charts and Action Mind Maps.- Types Of Polygon With Diagram
- Geometrical Diagram
- Butt weld geometry | Mathematics Symbols | Mathematical Diagrams ...
- Geometrical Designs Diagrams
- Basic Geometry Diagrams In Math
- Types Of Geometry Diagrams
- Geometry Diagrams
- Plane geometry - Vector stencils library | The Diagram Of Plane ...
- Rapid UML | Example 0 F Cuboid Shape