Managing the task list

Planning a Trip with ConceptDraw PROJECT
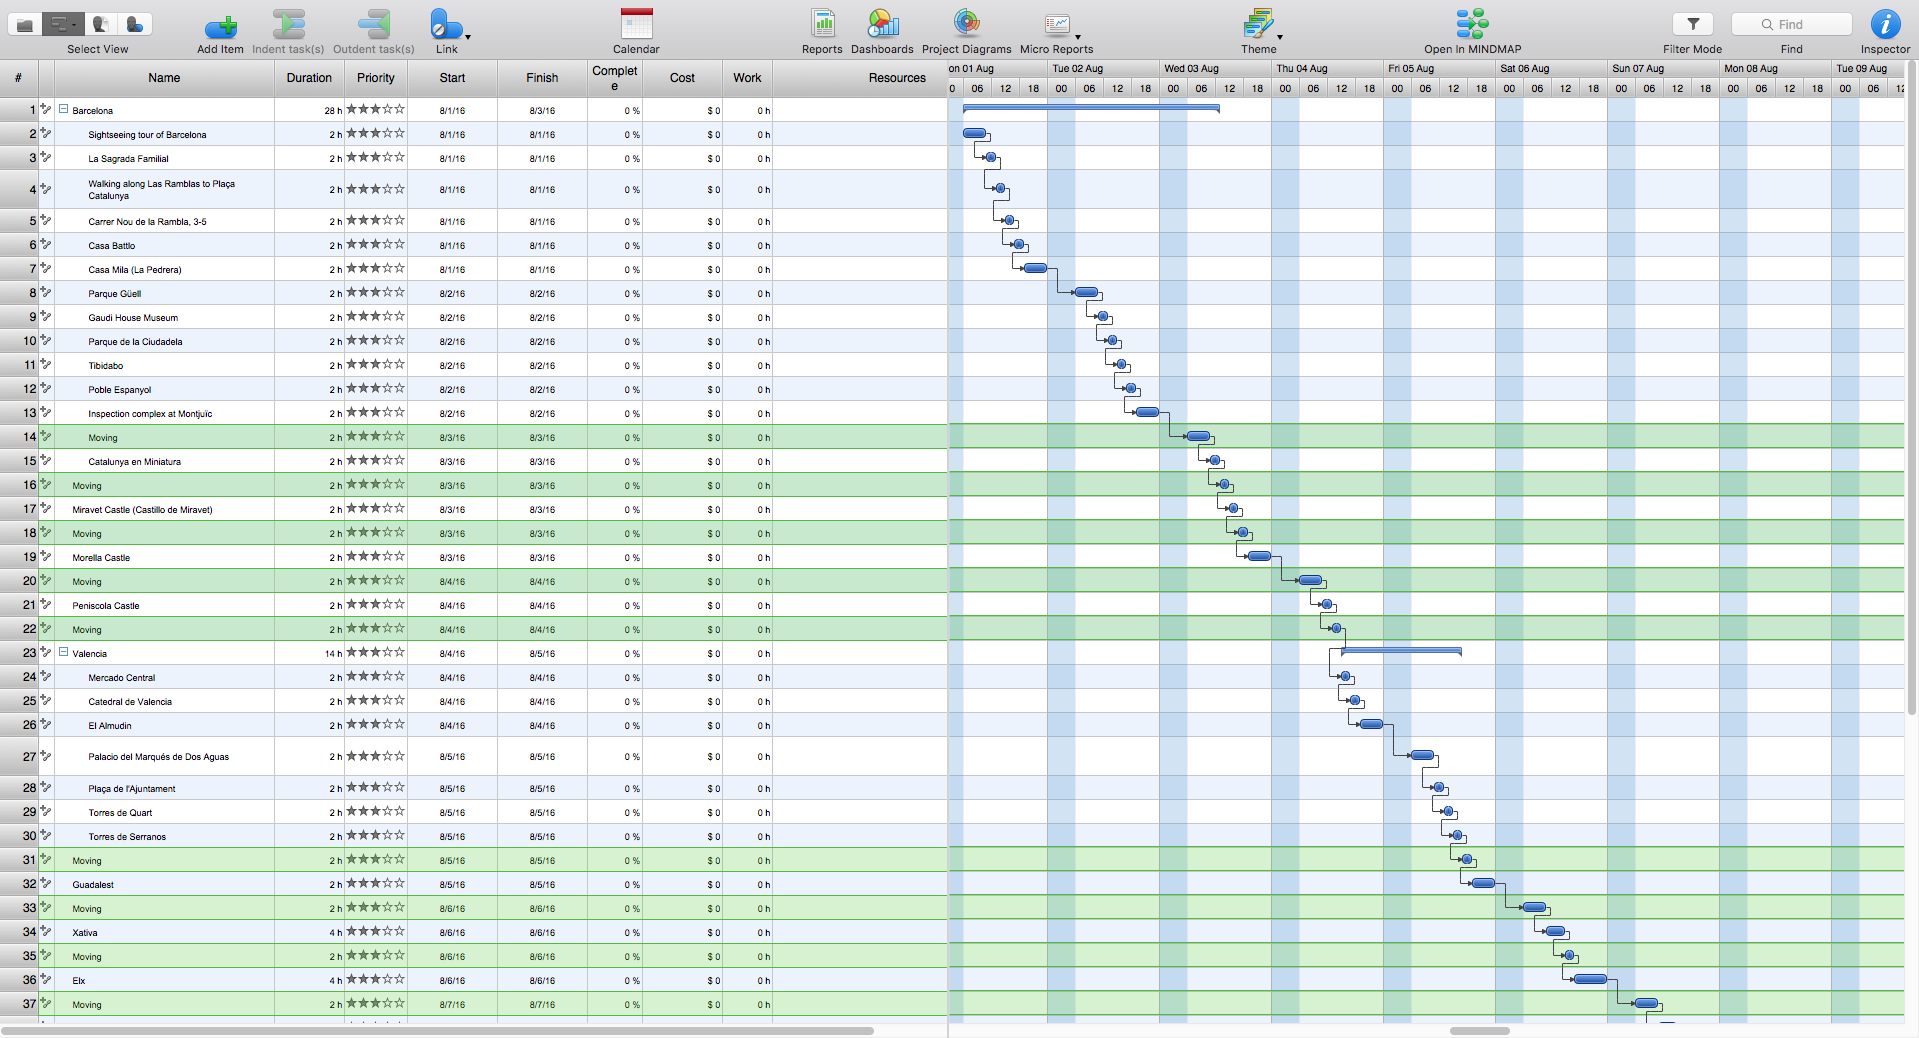
Gant Chart in Project Management


Gantt Chart Software

Program Evaluation and Review Technique (PERT) with ConceptDraw DIAGRAM

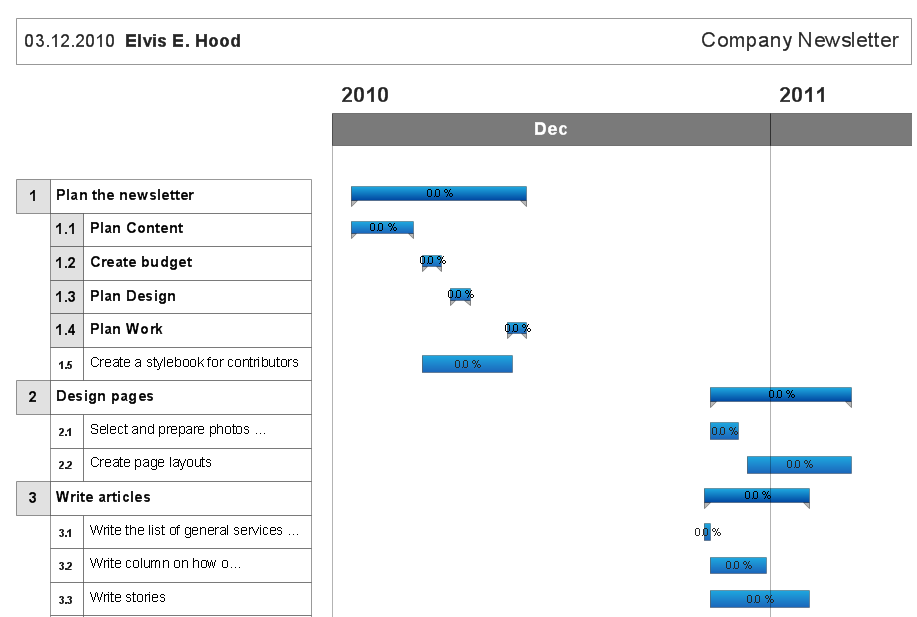
Gantt Chart Diagram
Activity Network Diagram Method

Program Evaluation and Review Technique (PERT) with ConceptDraw DIAGRAM
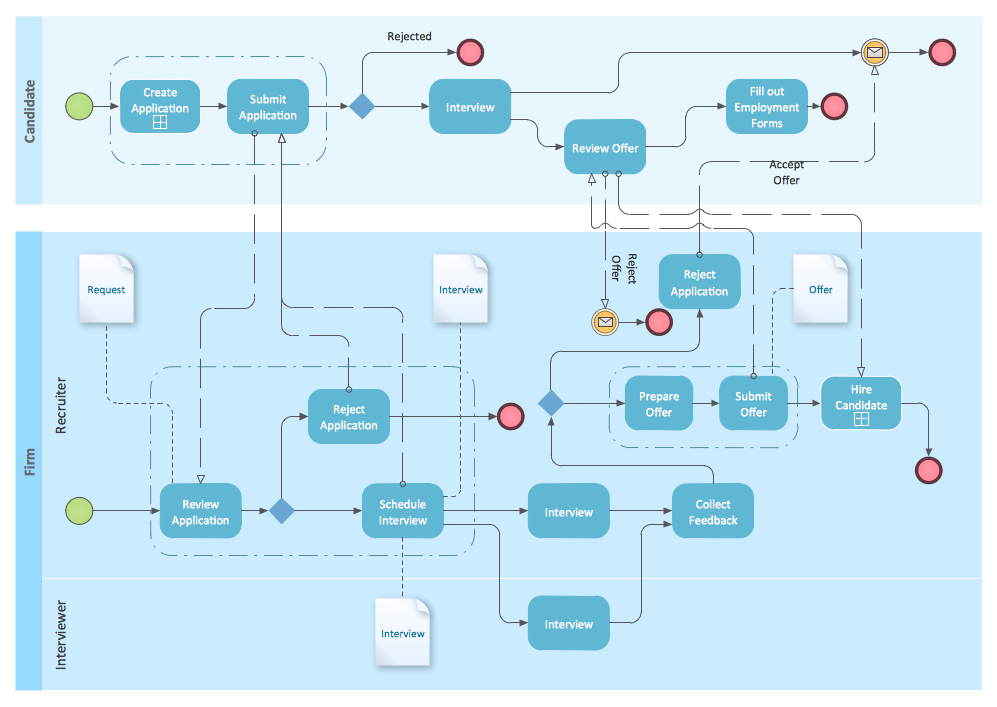
BPMN
 Timeline Diagrams
Timeline Diagrams solution extends ConceptDraw DIAGRAM diagramming software with samples, templates and libraries of specially developed smart vector design elements of timeline bars, time intervals, milestones, events, today marker, legend, and many other elements with custom properties, helpful for professional drawing clear and intuitive Timeline Diagrams. Use it to design simple Timeline Diagrams and designate only the main project stages, or highly detailed Timeline Diagrams depicting all project tasks, subtasks, milestones, deadlines, responsible persons and other description information, ideal for applying in presentations, reports, education materials, and other documentation.
- How to Add a Color Marker to Project Task on the Gantt Chart ...
- What Information to be Displayed in the ConceptDraw PROJECT ...
- Gantt chart examples | Gant Chart in Project Management | Gantt ...
- Gantt Chart Software | Project — Working With Costs | Product ...
- Gantt Chart Software | Process Flowchart | Product Overview ...
- Gant Chart in Project Management | How to Create Presentation of ...
- Gantt charts for planning and scheduling projects | Business ...
- Gantt charts for planning and scheduling projects | Project —Task ...
- Gantt Chart Software | Project — Working With Costs | Gant Chart in ...
- What Information to be Displayed in the ConceptDraw PROJECT ...