Functional Flow Block Diagram
You need to draw a Functional Flow Block Diagram? You are an artist? Now it doesn't matter. With Block Diagrams solution from the "Diagrams" area for ConceptDraw Solution Park you don't need more to be an artist to design the Functional Flow Block Diagram of any complexity.IDEF4 Standard
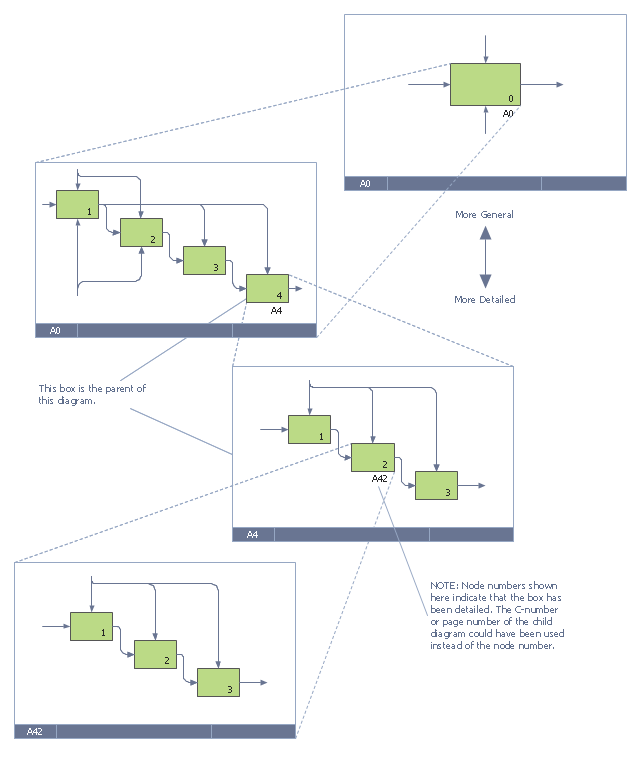
Use Case Diagrams technology. IDEF4 standard implies not only graphical presentation but the additional information about diagrams of heredity, methods systematization and types which are contained in specifications.This IDEF0 diagram example was redesigned from the Wikimedia Commons file: 6 Decomposition Structure.svg.
[commons.wikimedia.org/ wiki/ File:6_ Decomposition_ Structure.svg]
"Functional decomposition refers broadly to the process of resolving a functional relationship into its constituent parts in such a way that the original function can be reconstructed (i.e., recomposed) from those parts by function composition. In general, this process of decomposition is undertaken either for the purpose of gaining insight into the identity of the constituent components (which may reflect individual physical processes of interest, for example), or for the purpose of obtaining a compressed representation of the global function, a task which is feasible only when the constituent processes possess a certain level of modularity (i.e., independence or non-interaction). Interactions between the components are critical to the function of the collection. All interactions may not be observable, but possibly deduced through repetitive perception, synthesis, validation and verification of composite behavior." [Functional decomposition. Wikipedia]
The example "IDEF0 diagram - Decomposition structure" was created using the ConceptDraw PRO diagramming and vector drawing software extended with the solution "IDEF Business Process Diagrams" from the area "Business Processes" of ConceptDraw Solution Park.
Program Structure Diagram
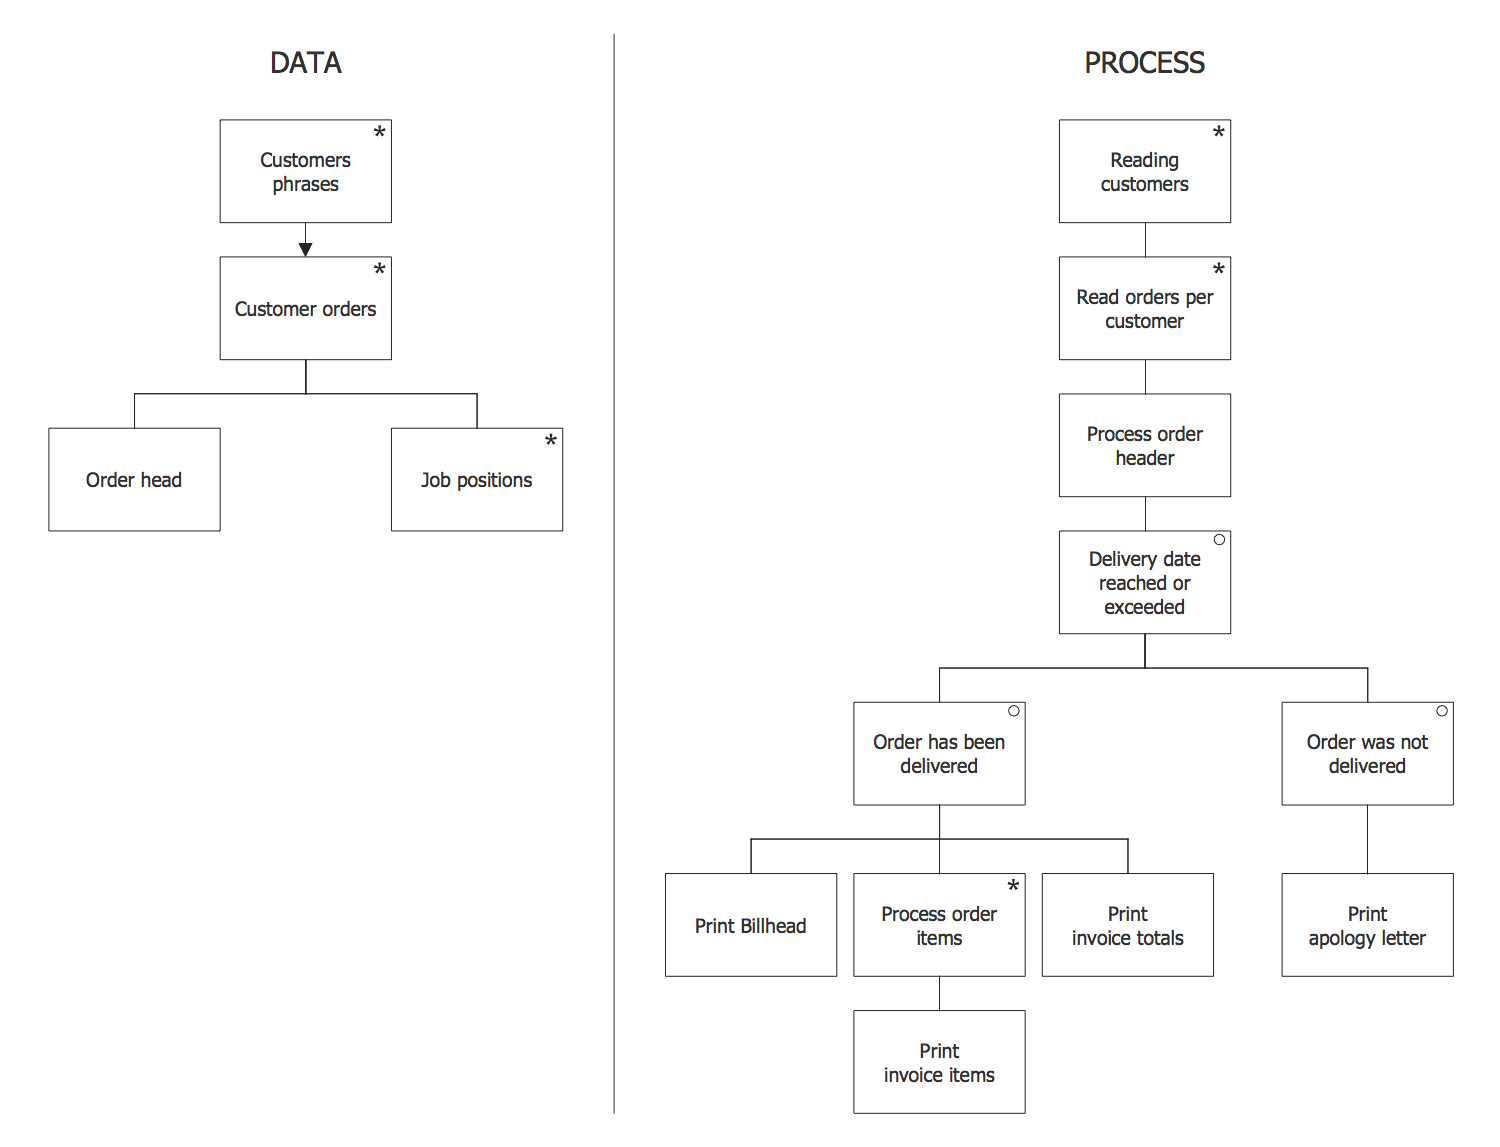
A visual representation of the configuration system, as well as the internal interfaces among such drawing’s CIs, may be always done with the help of the professional tool, such as the ConceptDraw DIAGRAM diagramming software. The structure diagram may be used for identifying the CIs as well as their associated artifacts. Doing it with the aid of ConceptDraw DIAGRAM as well as its extension (the Jackson Structured Programming (JSP) Diagrams solution) may simplify anyone’s work of making such diagrams.UML Use Case Diagram Example. Social Networking Sites Project
UML Diagrams Social Networking Sites Project. This sample was created in ConceptDraw DIAGRAM diagramming and vector drawing software using the UML Use Case Diagram library of the Rapid UML Solution from the Software Development area of ConceptDraw Solution Park. This sample shows the Facebook Socio-health system and is used at the projection and creating of the social networking sites.IDEF0 standard with ConceptDraw DIAGRAM
The activity of any organization is more or less branchy network of processes. The description of these processes is a hard technical task which requires definite methodology and standards. According to the IDEF0 standard any process can be described in the form of a block (Activity Box) which has inputs and outputs. The process consists in transformation of inputs into outputs under the influence of the management and in the presence of necessary resources. Outputs of the given process later on can be either inputs for the next process or resources, or management means.Types of Flowcharts
A Flowchart is a graphical representation of process, algorithm, workflow or step-by-step solution of the problem. It shows the steps as boxes of various kinds and connects them by arrows in a defined order depicting a flow. There are twelve main Flowchart types: Basic Flowchart, Business Process Modeling Diagram (BPMN), Cross Functional Flowchart, Data Flow Diagram (DFD), IDEF (Integrated DEFinition) Flowchart, Event-driven Process Chain (EPC) Diagram, Influence Diagram (ID), Swimlane Flowchart, Process Flow Diagram (PFD), Specification and Description Language (SDL) Diagram, Value Stream Mapping, Workflow Diagram. Using the Flowcharts solution from the Diagrams area of ConceptDraw Solution Park you can easy and quickly design a Flowchart of any of these types. This solution offers a lot of special predesigned vector symbols for each of these widely used notations. They will make the drawing process of Flowcharts much easier than ever. Pay also attention for the included collection of ready Flowchart examples, samples and quick-start templates. This is business process improvement tools. If you are looking for MS Visio for your Mac, then you are out of luck, because it hasn't been released yet. However, you can use Visio alternatives that can successfully replace its functions. ConceptDraw DIAGRAM is an alternative to MS Visio for Mac that provides powerful features and intuitive user interface for the same.
Cross Functional Diagram
You want design the Cross Functional Diagram and need powerful software? Then ConceptDraw DIAGRAM diagramming and vector drawing software extended with Cross-Functional Flowcharts Solution is exactly what you need.Double-headed Cross Functional Flowchart
ConceptDraw DIAGRAM is a powerful tool that helps you create a Cross Functional Flow Chart quickly and easily. Fine-tuning the objects in ConceptDraw DIAGRAM allows you to create a really professional finished article. ConceptDraw Arrows10 Technology gives drawing connectors a smart behavior that provides quick and precise placement, allows for easy changes and automatic rearrangement.Cross Functional Flowchart Examples
Take a look on an example of Cross-Functional-Flowchart, showing the software service cross-function process flowcharts among the different departments. It presents a simple flowchart among the customer, sales, technical support, tester and development. Try now Flowchart Software and Cross-Functional library with 2 libraries and 45 vector shapes of the Cross-Functional Flowcharts solution. Then you can use built-in templates to create and present your software service cross-function process flowcharts.- How To Draw Functional Decomposition Diagram
- Functional Decomposition Diagram For Library Management System
- Functional Decomposition Symbols
- Draw A Functional Decomposition Structured Chart Diagram For
- IDEF0 diagram - Decomposition structure | Business diagrams & Org ...
- IDEF0 diagram - Decomposition structure | 25 Typical Orgcharts ...
- IDEF0 Diagrams | IDEF Business Process Diagrams | Application ...
- Draw A Decomposition Of A Project
- Functional Decomposition Diagram Visio
- Diagramming Software for Design UML Interaction Overview ...


