Mathematical Diagrams

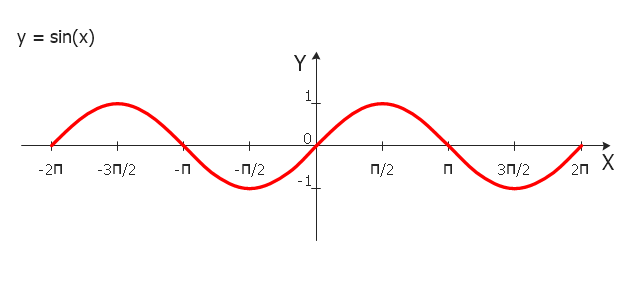
"In mathematics, the sine function is a trigonometric function of an angle. The sine of an angle is defined in the context of a right triangle: for the specified angle, it is the ratio of the length of the side that is opposite that angle to (divided by) the length of the longest side of the triangle (i.e. the hypotenuse).
Trigonometric functions are commonly defined as ratios of two sides of a right triangle containing the angle, and can equivalently be defined as the lengths of various line segments from a unit circle. More modern definitions express them as infinite series or as solutions of certain differential equations, allowing their extension to arbitrary positive and negative values and even to complex numbers.
The sine function is commonly used to model periodic phenomena such as sound and light waves, the position and velocity of harmonic oscillators, sunlight intensity and day length, and average temperature variations throughout the year." [Sine. Wikipedia]
The trigonometric function graph example "Sine function" was created using the ConceptDraw PRO diagramming and vector drawing software extended with the Mathematics solution from the Science and Education area of ConceptDraw Solution Park.
Sine function graph
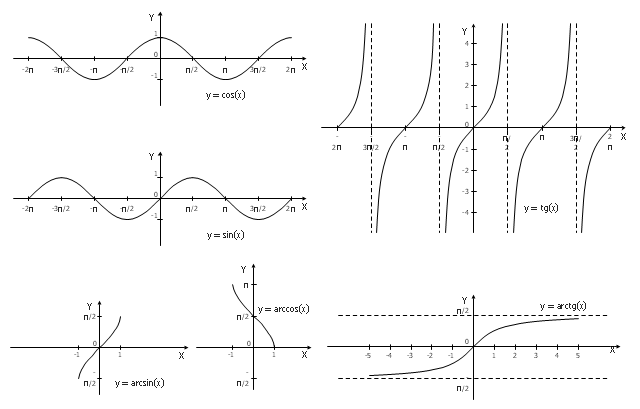
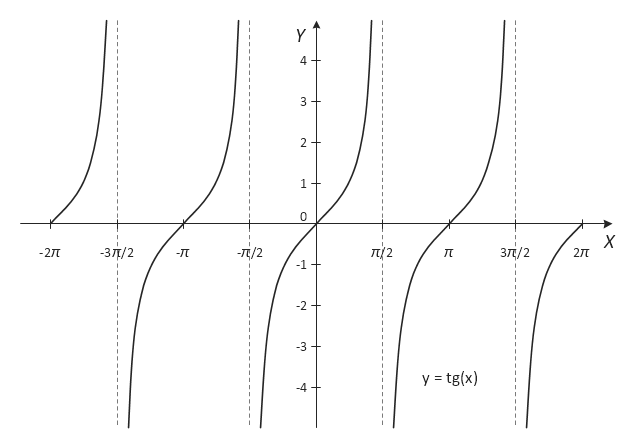
The vector stencils library "Trigonometric functions" contains 8 shapes of trigonometrical and inverse trigonometrical functions graphs.
"In mathematics, the trigonometric functions (also called the circular functions) are functions of an angle. They relate the angles of a triangle to the lengths of its sides. Trigonometric functions are important in the study of triangles and modeling periodic phenomena, among many other applications.
The most familiar trigonometric functions are the sine, cosine, and tangent. In the context of the standard unit circle with radius 1 unit, where a triangle is formed by a ray originating at the origin and making some angle with the x-axis, the sine of the angle gives the length of the y-component (the opposite to the angle or the rise) of the triangle, the cosine gives the length of the x-component (the adjacent of the angle or the run), and the tangent function gives the slope (y-component divided by the x-component). More precise definitions are detailed below. Trigonometric functions are commonly defined as ratios of two sides of a right triangle containing the angle, and can equivalently be defined as the lengths of various line segments from a unit circle. More modern definitions express them as infinite series or as solutions of certain differential equations, allowing their extension to arbitrary positive and negative values and even to complex numbers." [Trigonometric functions. Wikipedia]
The shapes example "Design elements - Trigonometric functions" was created using the ConceptDraw PRO diagramming and vector drawing software extended with the Mathematics solution from the Science and Education area of ConceptDraw Solution Park.
Trigonometrical and inverse trigonometrical functions - Graphs
 Mathematics
Mathematics solution extends ConceptDraw PRO software with templates, samples and libraries of vector stencils for drawing the mathematical illustrations, diagrams and charts.
Mathematics Symbols

Basic Flowchart Symbols and Meaning


Cross Functional Diagram

Venn Diagram Examples for Problem Solving. Venn Diagram as a Truth Table

Venn Diagram

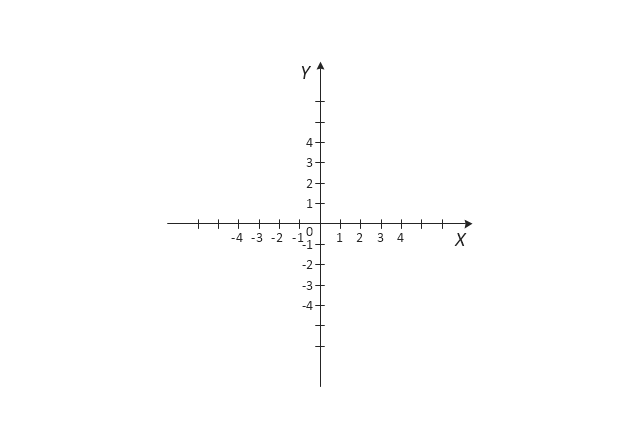
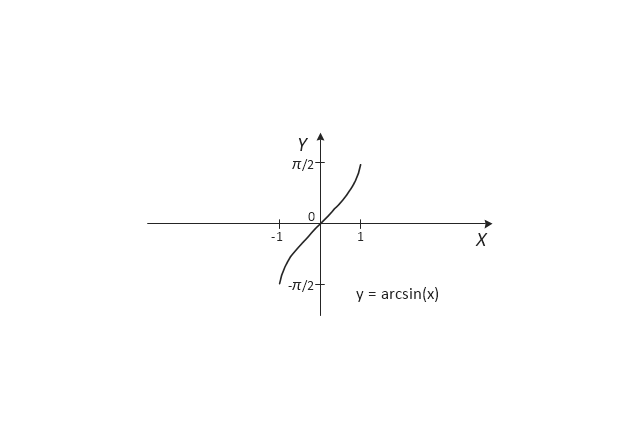
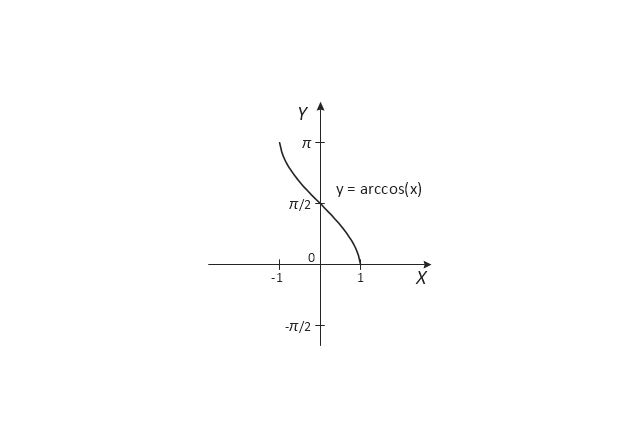
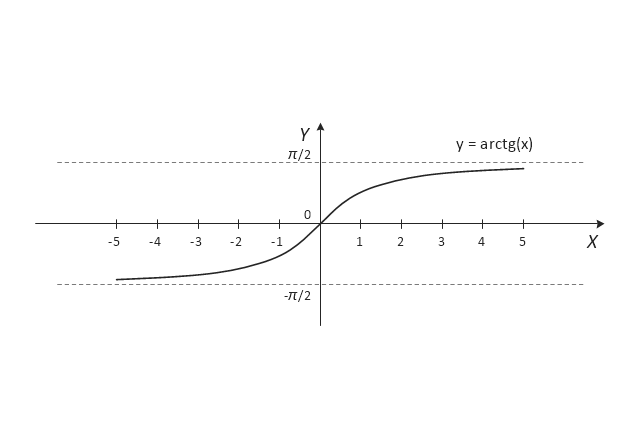
The vector stencils library "Trigonometric functions" contains 8 shapes of trigonometrical and inverse trigonometrical functions graphs: sine, cosine, tangent, arcsine, arccosine, arctangent, system axes.
Use these shapes to draw your geometrical diagrams and illustrations in the ConceptDraw PRO diagramming and vector drawing software extended with the Mathematics solution from the Science and Education area of ConceptDraw Solution Park.
Use these shapes to draw your geometrical diagrams and illustrations in the ConceptDraw PRO diagramming and vector drawing software extended with the Mathematics solution from the Science and Education area of ConceptDraw Solution Park.
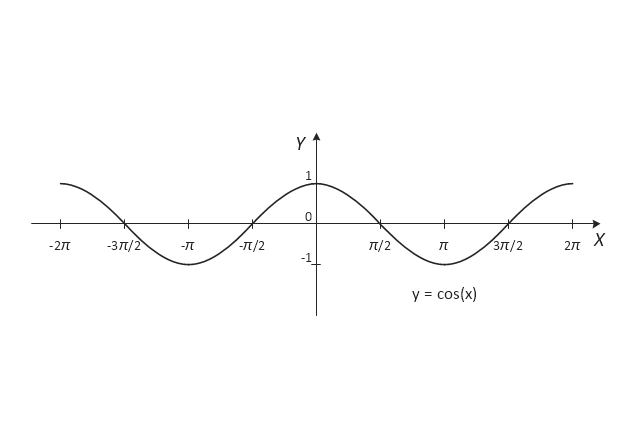
Cosine
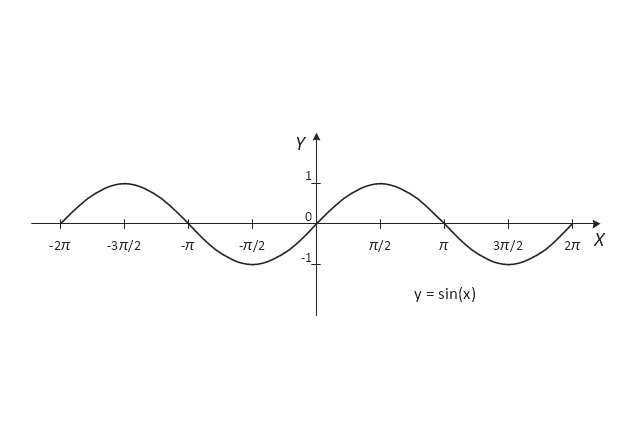
Sine
Tangent
Cartesian coordinate system
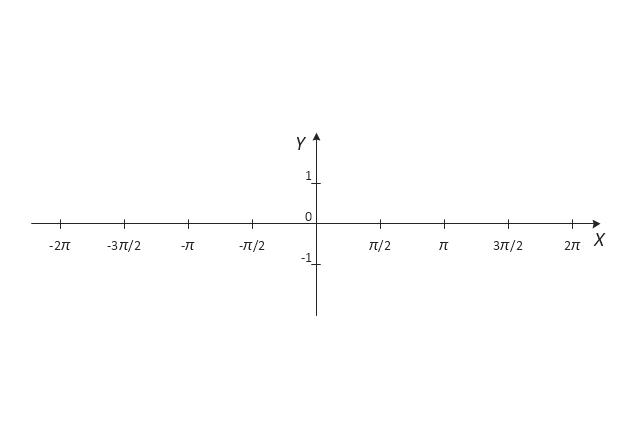
Cartesian coordinate system in two dimensions
Arcsine
Arccosine
Arctangent
 Cross-Functional Flowcharts
Cross-functional flowcharts are powerful and useful tool for visualizing and analyzing complex business processes which requires involvement of multiple people, teams or even departments. They let clearly represent a sequence of the process steps, the order of operations, relationships between processes and responsible functional units (such as departments or positions).
HelpDesk
How to Draw a Circular Arrows Diagram Using ConceptDraw PRO

"In elementary algebra, a quadratic equation (from the Latin quadratus for "square") is any equation having the form
ax^2+bx+c=0
where x represents an unknown, and a, b, and c are constants with a not equal to 0. If a = 0, then the equation is linear, not quadratic. The constants a, b, and c are called, respectively, the quadratic coefficient, the linear coefficient and the constant or free term.
Because the quadratic equation involves only one unknown, it is called "univariate". The quadratic equation only contains powers of x that are non-negative integers, and therefore it is a polynomial equation, and in particular it is a second degree polynomial equation since the greatest power is two.
Quadratic equations can be solved by a process known in American English as factoring and in other varieties of English as factorising, by completing the square, by using the quadratic formula, or by graphing." [Quadratic equation. Wikipedia]
The flowchart example "Solving quadratic equation algorithm" was created using the ConceptDraw PRO diagramming and vector drawing software extended with the Mathematics solution from the Science and Education area of ConceptDraw Solution Park.
Solving quadratic equation flow chart

Scientific Symbols Chart

Mathematics Solution from the Science and Education area of ConceptDraw Solution Park includes a few shape libraries of plane, solid geometric figures, trigonometrical functions and greek letters to help you create different professional looking mathematic illustrations for science and education.
- Design elements - Trigonometric functions | Mathematics Symbols ...
- Mathematics | Design elements - Trigonometric functions | Sine ...
- Mathematical Diagrams | Mathematics | Flowchart For Sin Function
- Design elements - Trigonometric functions | Sine function ...
- Basic Flowchart Symbols and Meaning | Mathematics | Draw And ...
- Basic Flowchart Symbols and Meaning | Mathematics Symbols ...
- Basic Flowchart Symbols and Meaning | Mathematics Symbols ...
- Basic Flowchart Symbols and Meaning | Mathematics Symbols ...
- Function Of The Stencil In Mathematical Set
- Functional Flow Block Diagram | Scatter Chart Examples ...
- Function hall floor plan | Sine function | Design elements ...
- Basic Diagramming | Mathematics | Mathematical Diagrams | Mind ...
- Mathematical Diagrams | Process Flowchart | Physics Symbols ...
- Mathematical Diagrams | Solving quadratic equation algorithm ...
- Mathematics Symbols | Mathematical Diagrams | Mathematics | Mind ...
- Sine function | Weather - Vector stencils library | Sunlight
- Draw And State The Function Of The Basic Geometrical Symbols
- Draw The Flow Chart Of An Algorithm Of Quadrant Function
- Mathematics Symbols | Physics Symbols | Mathematics | Symbol Of ...
- Draw And State The Function Of The Basic Geometrical That Are