This site uses cookies. By continuing to browse the ConceptDraw site you are agreeing to our Use of Site Cookies.

bubble chart, bubble chart creator, bubble diagram Bubble Diagrams

bubble chart, bubble chart creator, bubble diagram
Bubble diagrams have enjoyed great success in software engineering, architecture, economics, medicine, landscape design, scientific and educational process, for ideas organization during brainstorming, for making business illustrations, presentations, planning, design, and strategy development. They are popular because of their simplicity and their powerful visual communication attributes.

Bubble Map Maker

The Bubble Map is a popular tool for visualization a data set which is widely used in economics, medicine, software engineering, architecture, and many other fields. Each bubble on the Bubble Map is characterized by coordinates, color and size. ConceptDraw DIAGRAM diagramming and vector drawing software extended with Bubble Diagrams Solution from the "Diagrams" Area is a powerful Bubble Map Maker.

Bubble diagrams with ConceptDraw DIAGRAM

Using ConceptDraw you will be able to create bubble diagrams from the ready ConceptDraw library objects or make your own objects. The created diagram can be saved and edited, objects can be moved and links between them will be automatically repainted after object moving because of using the ConceptDraw connectors.

Bubble diagrams in Landscape Design with ConceptDraw DIAGRAM

Creation of a bubble diagrams in ConceptDraw is an easy task as you can use the ready scanned location plan instead of plotting paper and paper location plan. Besides scanning of the ready paper location plan you can easy create it using special ConceptDraw libraries and templates for creation room plans and location plans.

Flow Diagram Software
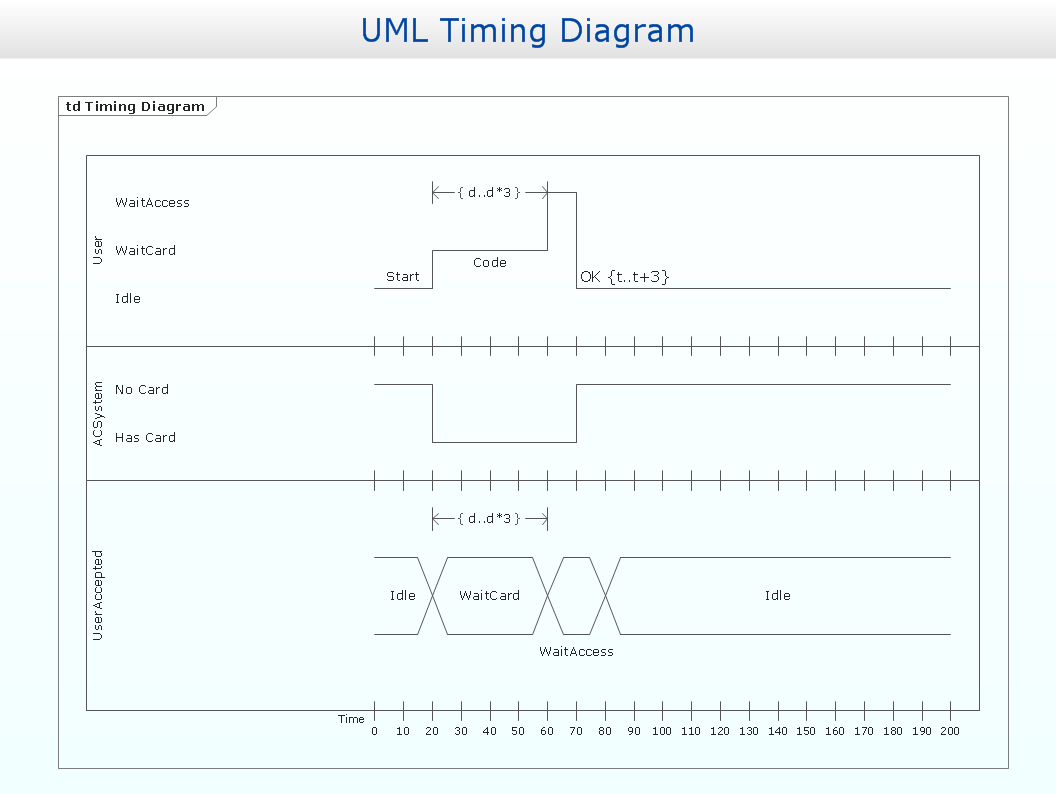
ConceptDraw is a professional Process Flow Diagram software. The basic set of the stencils libraries, samples and templates allows you to draw any type of flowchart. Flowcharts give to users the ability to represent structural data visually. One can draw own flowchart in seconds by using RapidDraw technology.

Timing diagram

UML Timing Diagram as special form of a sequence diagram is used to explore the behaviours of objects throughout a given period of time.

Tools to Create Your Own Infographics

Over the past few centuries, data visualization has evolved so much that we use it every day in all areas of our lives. Many believe that infographic is an effective tool of storytelling, as well as analytics, and that it is able to overcome most of the language and educational barriers. Understanding the mechanisms of human perception will help you to understand how abstract forms and colors used in data visualization can transmit information more efficient than long paragraphs of text.

SWOT analysis, TOWS analysis SWOT and TOWS Matrix Diagrams

SWOT analysis, TOWS analysis
SWOT and TOWS Matrix Diagrams solution extends ConceptDraw DIAGRAM and ConceptDraw MINDMAP software with features, templates, samples and libraries of vector stencils for drawing SWOT and TOWS analysis matrices and mind maps.

Bubble Charts

Bubble Charts are convenient way to visualize ideas and concepts by organizing them in a hierarchy. To show the importance of ideas you can use different bubble sizes and colors. ConceptDraw DIAGRAM diagramming and vector drawing software extended with Bubble Diagrams Solution from the "Diagrams" Area affords you the easiest and fastest way for designing professional looking Bubble Charts.

How To Create a Flow Chart in ConceptDraw

ConceptDraw DIAGRAM is a flowchart creating software. This software includes over 20 vector stencils in libraries. These objects allow you to create well-designed flowcharts.
Put an initial object from library to a page and use RapidDraw technology clicking on direction arrows to add new objects to the flowchart. This way you can make flowchart quickly.