Business Process Flowchart Symbols

This audit flowchart sample was created on the base of the figure illustrating the webpage "Introduction to Claims Edits, Audits, Error Status Codes, and EOBs" from the website of the Ohio Department of Medicaid.
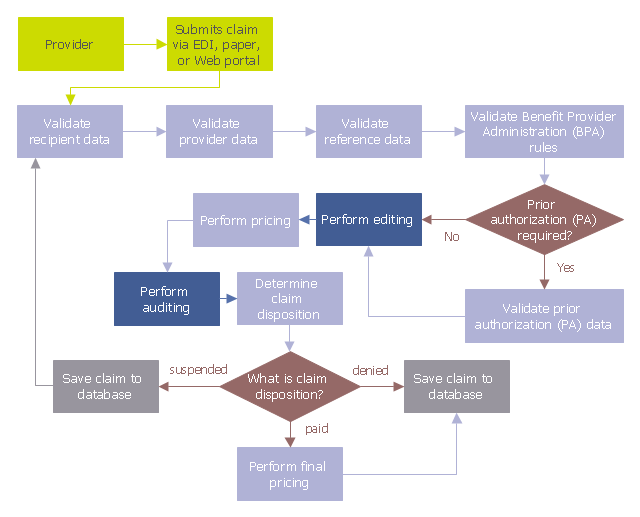
"Process.
As claims are submitted and processed, the data on the claim is validated against a series of rules, edits, and audits. Review the flowchart below to follow the sequence in which claim data is processed to see where edits and audits impact the claim adjudication process." [medicaid.ohio.gov/ PROVIDERS/ MITS/ MITSNonProviderCommunications/ MITSOnlineTutorials/ IntroductiontoClaimsEdits,Audits.aspx]
The audit flowchart example "Claim data processing" was created using the ConceptDraw PRO diagramming and vector drawing software extended with the Audit Flowcharts solution from the Finance and Accounting area of ConceptDraw Solution Park.
www.conceptdraw.com/ solution-park/ finance-audit-flowcharts
Audit flowchart
Flowchart What is Flowchart

 Sales Flowcharts
The Sales Flowcharts solution lets you create and display sales process maps, sales process workflows, sales steps, the sales process, and anything else involving sales process management.
 Business Process Mapping
The Business Process Mapping solution has a collection of vector graphic libraries, pre-made templates, and examples of the business process maps. They are useful for many business specialists including economists, politicians, analysts, and other economic experts, officials and state managers for making the unique and professionally looking drawings. Use it to create an effective Business process map, SIPOC diagram, Swim lanes flowchart and clearly define the necessary business processes due to their inputs and outputs.
Cross Functional Flowchart Symbols

Chart Examples

Project —Task Trees and Dependencies

 Cross-Functional Flowcharts
The Cross-Functional Flowcharts solution extends ConceptDraw DIAGRAM software with cross functional flowchart examples, samples, and libraries of cross functional flow chart vector design elements and CH-1 symbols for easy drawing professional-looking and illustrative Cross Functional Flowchart, Cross Functional Diagram, CH-1 Diagram, Process Flowchart, Deployment Flowchart, Opportunity Flowchart, Swimlane Process Mapping Diagram, or Visio Cross Functional Flowchart for planning and further analyzing, optimizing and improvement processes. The use of included pre-made cross functional flowchart template, opportunity flowchart template, and swimlane process map template, greatly easier designing your Cross-functional flowcharts.
Horizontal Flowchart

SDL Flowchart Symbols

What is the Accounting Cycle?

Cross-Functional Flowchart


How to Draw an Organizational Chart

Chart Templates

Examples of Flowcharts, Org Charts and More


 Logistics Flow Charts
Logistics Flow Charts solution extends ConceptDraw DIAGRAM functionality with opportunities of powerful logistics management software. It provides large collection of predesigned vector logistic symbols, pictograms, objects and clipart to help you design with pleasure Logistics flow chart, Logistics process flow diagram, Inventory flow chart, Warehouse flowchart, Warehouse management flow chart, Inventory control flowchart, or any other Logistics diagram. Use this solution for logistics planning, to reflect logistics activities and processes of an enterprise or firm, to depict the company's supply chains, to demonstrate the ways of enhancing the economic stability on the market, to realize logistics reforms and effective products' promotion.
Business Process Model and Notation Elements: Activities


- Flowchart Of Cosine Series
- Flowchart For Gp Series
- How to Create a Time Series Dashboard | Basic Flowchart Symbols ...
- Mathematical Diagrams | Geo Map | Flowchart For Sine Series
- Mathematical Diagrams | Flowchart And Algorithm For Sum Of G P ...
- Design elements - Process flowchart | How to Create a Time Series ...
- Audit Flowcharts | Basic Audit Flowchart . Flowchart Examples | Audit ...
- Swim Lane Diagrams | Swim Lane Flowchart Symbols | Cross ...
- HR Flowcharts | Time Series Dashboard | Circle-Spoke Diagrams ...
- How to Create a Time Series Dashboard | Process Flowchart