Basic Flowchart Symbols and Meaning


Cross-Functional Flowchart


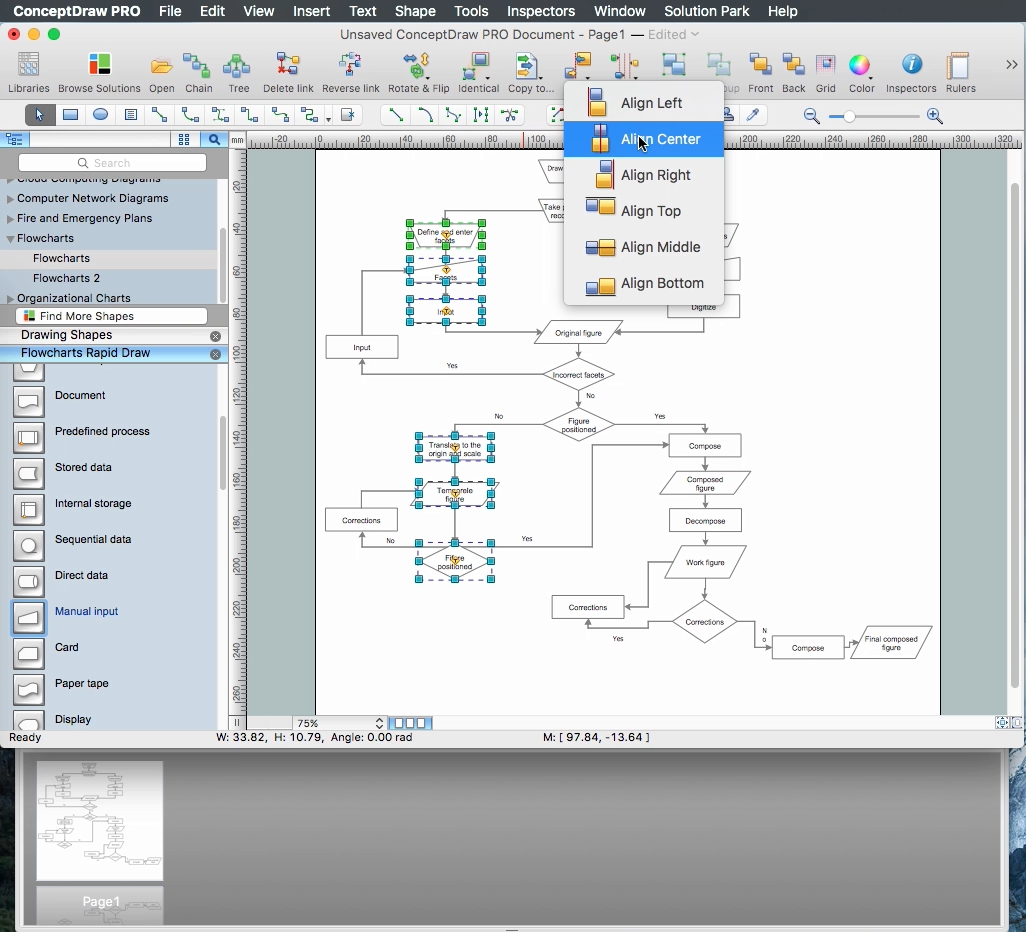
How to Build a Flowchart
Flowchart Examples

Swim Lane Flowchart Symbols

Flowchart Programming Project. Flowchart Examples

The Best Flowchart Software Available


 Business Process Mapping
The Business Process Mapping solution for ConceptDraw DIAGRAM is for users involved in process mapping and creating SIPOC diagrams.
Data Flow Diagram Symbols. DFD Library

Garrett IA Diagrams with ConceptDraw DIAGRAM

- How To Continue Flow Chart In Next Page
- How To Continue Flow Chart To Next Page
- Flow Chart Next Page Symbol
- Next Symbol In Flowchart
- Flowchart - Vector stencils library | Design elements - Flowchart ...
- Basic Flowchart Symbols and Meaning | Audit Flowchart Symbols ...
- Audit Flowchart Symbols | Basic Flowchart Symbols and Meaning ...
- CS Odessa Introduces ConceptDraw Office v4
- Design elements - UML sequence diagrams | Design elements ...