, t chart, decision matrix, decision tree analysis") Decision Making
Decision Making
The Decision Making solution offers the set of professionally developed examples, powerful drawing tools and a wide range of libraries with specific ready-made vector decision icons, decision pictograms, decision flowchart elements, decision tree icons, decision signs arrows, and callouts, allowing the decision maker (even without drawing and design skills) to easily construct Decision diagrams, Business decision maps, Decision flowcharts, Decision trees, Decision matrix, T Chart, Influence diagrams, which are powerful in questions of decision making, holding decision tree analysis and Analytic Hierarchy Process (AHP), visual decomposition the decision problem into hierarchy of easily comprehensible sub-problems and solving them without any efforts.
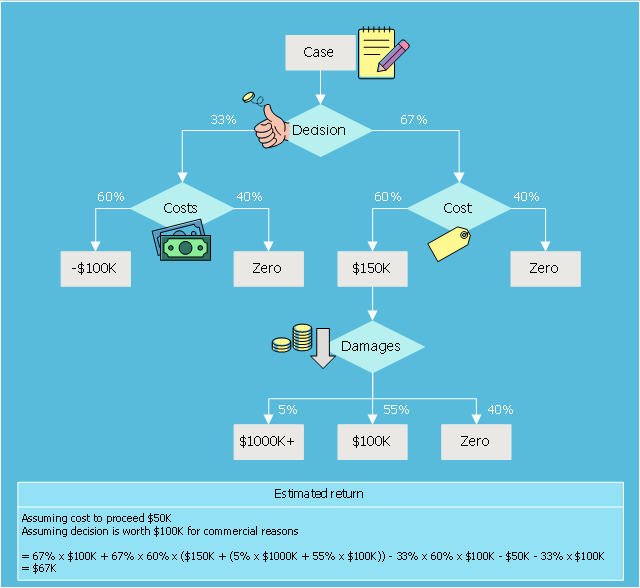
This example was designed on the base of Wikimedia Commons file: Decision tree using flow chart symbols.jpg.
"This is a decision tree that is written using flow chart symbols."
[commons.wikimedia.org/ wiki/ File:Decision_ tree_ using_ flow_ chart_ symbols.jpg]
This file is licensed under the Creative Commons Attribution-Share Alike 3.0 Unported license. [creativecommons.org/ licenses/ by-sa/ 3.0/ deed.en]
"A decision tree is a flowchart-like structure in which each internal node represents a "test" on an attribute (e.g. whether a coin flip comes up heads or tails), each branch represents the outcome of the test, and each leaf node represents a class label (decision taken after computing all attributes). The paths from root to leaf represent classification rules." [Decision tree. Wikipedia]
The diagram example "Decision tree flowchart" was designed using ConceptDraw software extended with Decision Making solution from Management area of ConceptDraw Solution Park.
Decision diagram example
CORRECTIVE ACTIONS PLANNING. Risk Diagram (PDPC)
 - Health care")

 Block Diagrams
Block diagrams solution extends ConceptDraw PRO software with templates, samples and libraries of vector stencils for drawing the block diagrams.
Fault Tree Diagram

ConceptDraw Arrows10 Technology

PDPC

Influence Diagram

 Marketing Diagrams
Marketing Diagrams solution extends ConceptDraw PRO diagramming software with abundance of samples, templates and vector design elements intended for easy graphical visualization and drawing different types of Marketing diagrams and graphs, including Branding Strategies Diagram, Five Forces Model Diagram, Decision Tree Diagram, Puzzle Diagram, Step Diagram, Process Chart, Strategy Map, Funnel Diagram, Value Chain Diagram, Ladder of Customer Loyalty Diagram, Leaky Bucket Diagram, Promotional Mix Diagram, Service-Goods Continuum Diagram, Six Markets Model Diagram, Sources of Customer Satisfaction Diagram, etc. Analyze effectively the marketing activity of your company and apply the optimal marketing methods with ConceptDraw PRO software.
Cross-Functional Flowchart


- Decision tree diagram | Decision Making | Fault Tree Diagram ...
- Fishbone Diagram Vs Decision Tree
- Decision tree diagram | Marketing Diagrams | Top 5 Android Flow ...
- Top 5 Android Flow Chart Apps | Data structure diagram with ...
- Decision tree diagram | ConceptDraw Arrows10 Technology | MS ...
- Fault Tree Diagram | MS Visio Look a Like Diagrams | Is ...
- Types of Flowcharts | Cause and Effect Analysis | Block Diagram ...
- Decision Tree Algorithm Flowchart And Sequence Daigram
- Product Overview | Benefits Of Using Decision Trees
- Decision Making | Root Cause Tree Diagram | Process Flowchart ...