This site uses cookies. By continuing to browse the ConceptDraw site you are agreeing to our Use of Site Cookies.

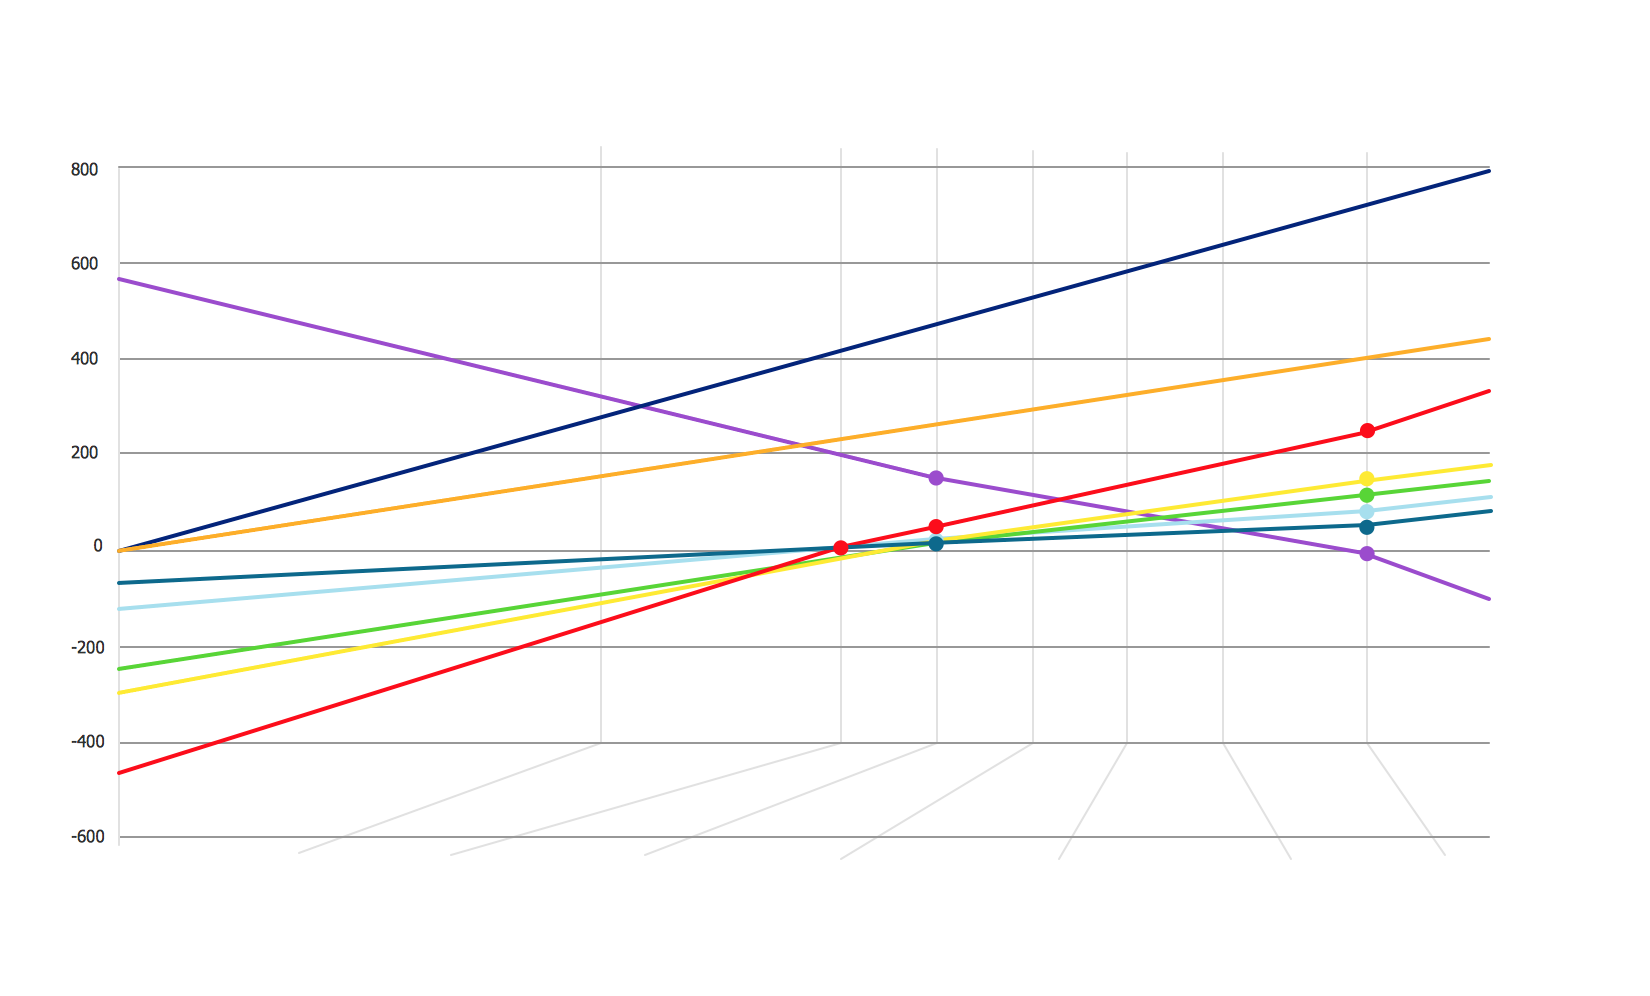
Financial Comparison Chart

This sample shows the Bar Chart of the leverage ratios for two major investment banks. The leverage ratio is the ratio of the total debt to the total equity; it is a measure of the risk taken by the bank. The higher of the leverage ratio denotes the more risk, the greater risks can lead to the subprime crisis.

Purchasing Flow Chart. Purchasing Flowchart Example

This sample shows the Purchasing Flow Chart Diagram that displays the money flow in the carbon offset sphere. The carbon offsets are the compensatory measures that the companies make for the carbon emissions. You can see on this sample the groups that have interests in the carbon offsets and the money flow after the carbon offset vendors sold the carbon offsets.

Comparison List

This sample was created in ConceptDraw DIAGRAM diagramming and vector drawing software using the Basic Diagramming Solution from the Universal Diagramming area of ConceptDraw Solution Park.

Flowchart on Bank. Flowchart Examples

This sample was created in ConceptDraw DIAGRAM diagramming and vector drawing software using the Flowcharts solution from the Diagrams area of ConceptDraw Solution Park.
This sample shows the Flowchart of the Subprime Mortgage Crisis. This Flowchart describes the decline in housing prices when the housing bubble burst and what it caused on the housing and financial markets. You can also see the Government and Industry responses in this crisis situation.
Create Flowchart on Bank

Column Chart Examples
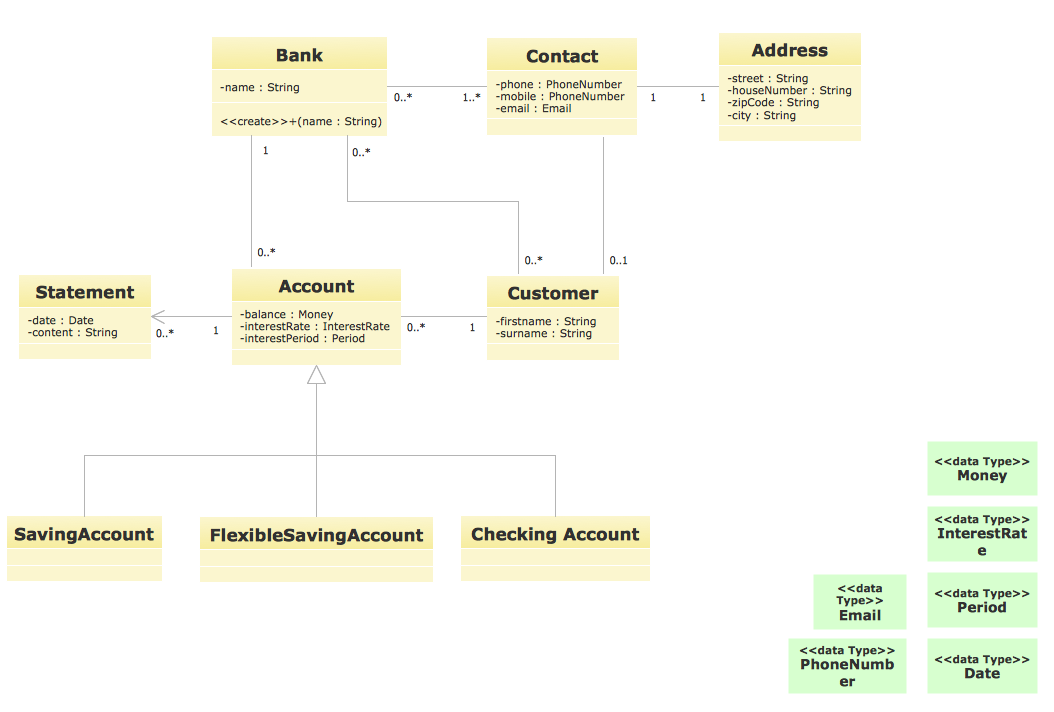
Column chart examples from ConceptDraw collection can help you find the best visual depiction for you data. You can easily modify column chart examples according to data you want to visualize.

UML for Bank

UML for Bank - This sample was created in ConceptDraw DIAGRAM diagramming and vector drawing software using the UML Class Diagram library of the Rapid UML Solution from the Software Development area of ConceptDraw Solution Park.

Feature Comparison Chart Software

An example of marketing analysis diagram, can be used to analyse product market and define marketing strategy.
This sample shows the Feature Comparison Chart of the digital scouting cameras. It can be useful for digital cameras production field, marketing, sales, etc.

Flowchart Examples and Templates

ConceptDraw provides a wide variety of examples such as flowcharts, organizational charts, business charts, and lots more. Please choose any examples you are interested in, alternatively download them for free; you will need to install ConceptDraw to view them. As you will see, ConceptDraw is very powerful, you can use more than 10000 symbols, examples, and many pre-drawn templates, to create your own spectacular flowcharts, business diagrams, and lots more, effortlessly, and in no time at all.

Sales Growth. Bar Graphs Example

This sample was created in ConceptDraw DIAGRAM diagramming and vector drawing software using the Bar Graphs Solution from Graphs and Charts area of ConceptDraw Solution Park. It is Bar Graphs example, Sales Growth example, Column Chart Example - Sales Report.

cross-functional flowchart template, flowchart, example business process flow Cross-Functional Flowcharts

cross-functional flowchart template, flowchart, example business process flow
Cross-functional flowcharts are powerful and useful tool for visualizing and analyzing complex business processes which requires involvement of multiple people, teams or even departments. They let clearly represent a sequence of the process steps, the order of operations, relationships between processes and responsible functional units (such as departments or positions).