This site uses cookies. By continuing to browse the ConceptDraw site you are agreeing to our Use of Site Cookies.

Sales Process Flowchart. Flowchart Examples

Create your own flow charts of sales business processes using the ConceptDraw PRO diagramming and vector drawing software extended with the Cross-Functional Flowcharts solution from the Business Processes area or Sales Flowcharts from the Marketing area of ConceptDraw Solution Park.

Example of DFD for Online Store (Data Flow Diagram) DFD Example

Data flow diagrams (DFDs) reveal relationships among and between the various components in a program or system. DFDs are an important technique for modeling a system’s high-level detail by showing how input data is transformed to output results through a sequence of functional transformations.
Example of DFD for Online Store shows the Data Flow Diagram for online store and interactions between the Visitors, Customers and Sellers, as well as Website Information and User databases.
Steps to Creating a Sales Process Flow Chart

sales process map, sales process flowchart, sales steps, sales process management Sales Flowcharts

sales process map, sales process flowchart, sales steps, sales process management
The Sales Flowcharts solution lets you create and display sales process maps, sales process workflows, sales steps, the sales process, and anything else involving sales process management.

Sales Process

ConceptDraw PRO is effective software for a variety of activity fields. Now, extended with Sales Flowcharts solution from the Marketing area of ConceptDraw Solution Park it become also useful in the field of sales. It helps to design professional looking Sales Flowcharts, Sales Process Flowcharts, Sales Process Maps, Plans and Diagrams to effectively realize the process of selling a product or service, and to display the sales results.

Sales Process Steps

Sales process engineering is a complex and labour-intensive process which requires a lot of time, efforts, and powerful software. We recommend to use the ConceptDraw PRO software enhanced with Sales Flowcharts solution from the Marketing area of ConceptDraw Solution Park. It gives the possibility to easy illustrate all sales process steps and their results.

Flow chart Example. Warehouse Flowchart

Warehouse Flowcharts are different diagrams describing wharehousing and inventory menagement processes. Typical purposes of warehouse flowcharts are evaluating warehouse performance and organizational performance, measuring efficiency of customer service. This type of workflow diagrams can be used for identifying any disconnection between business activities and business objectives.
Standard warehousing process flow diagram and standard workflow diagram used for process identification for further evaluating effectiveness and profitability of overall business process. Use the ConceptDraw PRO diagramming and vector drawing software extended with the Flowcharts solution from the Diagrams area of ConceptDraw Solution Park to design your own workflow diagrams, process flow diagram and flow charts. Need to use Process Flow Diagram for designing Warehouse packages flow.
ConceptDraw Arrows10 Technology

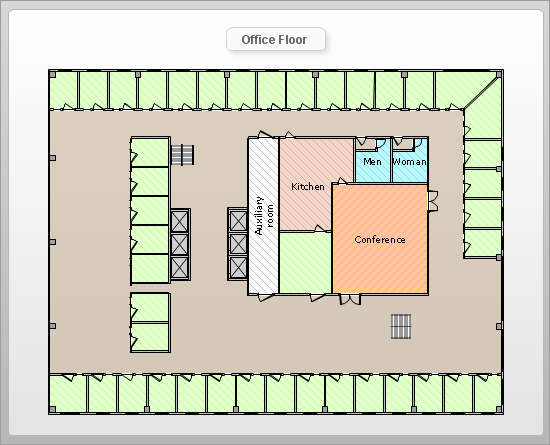
Restaurant Floor Plans Samples

Whether you already started or just planning to open a restaurant, first you have to design the place itself. Sounds complex? No worries, we are here to help.
ConceptDraw for successfully planning your restaurant floor plans. That tool can help you to plan what you will require.
The software includes sample: restaurant floor and cafe plans, restaurant floor plan layout, restaurant design, restaurant electrical plan, restaurant emergency plans, restaurant landscape design.

How To Create Floor Plans

Floor Plan Software — Create Floor Plans with examples. Home Plan is quick and planning software for creating great-looking designs.

Entity Relationship Diagram - ERD - Software for Design Crows Foot ER Diagrams

Crow's Foot notation was proposed by Gordon Everest. According to this notation, the entity is represented by rectangle, relation is depicted by line which ties two entities involved in a relationship. Entity-relationship diagrams based on both Chen's and Crow's Foot notations, can be easily drawn using the ConceptDraw PRO ERD diagrams software tools for design element Crow's Foot and Chen from Entity-Relationship Diagram (ERD) solution.
How to Build an Entity Relationship Diagram (ERD)

wireless communications, WLAN, wireless solution, wireless networking Wireless Networks

wireless communications, WLAN, wireless solution, wireless networking
The Wireless Networks Solution extends ConceptDraw PRO software with professional diagramming tools, set of wireless network diagram templates and samples, comprehensive library of wireless communications and WLAN objects to help network engineers and designers efficiently design and create Wireless network diagrams that illustrate wireless networks of any speed and complexity, and help to identify all required equipment for construction and updating wireless networks, and calculating their costs.