 Fishbone Diagrams
The Fishbone Diagrams solution extends ConceptDraw PRO v10 software with the ability to easily draw the Fishbone Diagrams (Ishikawa Diagrams) to clearly see the cause and effect analysis and also problem solving. The vector graphic diagrams produced using this solution can be used in whitepapers, presentations, datasheets, posters, and published technical material.
 Cafe and Restaurant Floor Plans
Restaurants and cafes are popular places for recreation, relaxation, and are the scene for many impressions and memories, so their construction and design requires special attention. Restaurants must to be projected and constructed to be comfortable and e
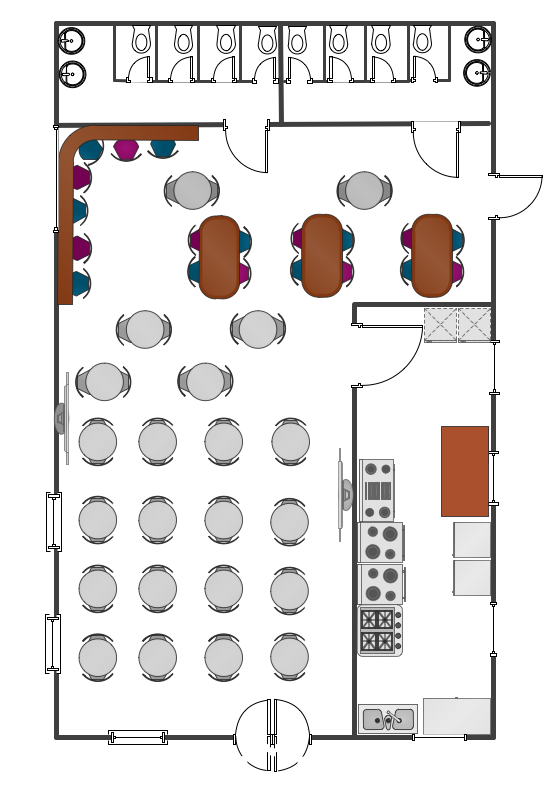
How To Create Restaurant Floor Plan in Minutes
Developing Floor Plans, Design Drawings, Plans of Furniture Placement for restaurants and cafes is one of the most responsible and important steps at their construction and designing. Selection of favorable design, the right style of furniture and decors largely determine the success and atmosphere of the institution. The restaurant floor planner ConceptDraw PRO is a perfect choice for architects and designers. Enhanced with Cafe and Restaurant Floor Plans solution it offers a lot of extensive vector symbol libraries and building plan elements for drawing Restaurant floor plans, Restaurant layouts, Restaurant furniture layouts, Cafe floor plans, Bar area floor plan, Fast food restaurant plan, etc. With ConceptDraw PRO you don't need to be an artist to create great-looking restaurant floor plan drawings in minutes, all needed drawing tools are delivered by Building Plans area solutions. Construct your own general plan of restaurant's premises, choose the furniture for your taste from the Cafe and Restaurant Floor Plans solution libraries and arrange it on the plan as you desire fast and easy. ConceptDraw PRO has many of the features found in Visio for Mac such as Drawing, Connection, Shape and Editing Tools.
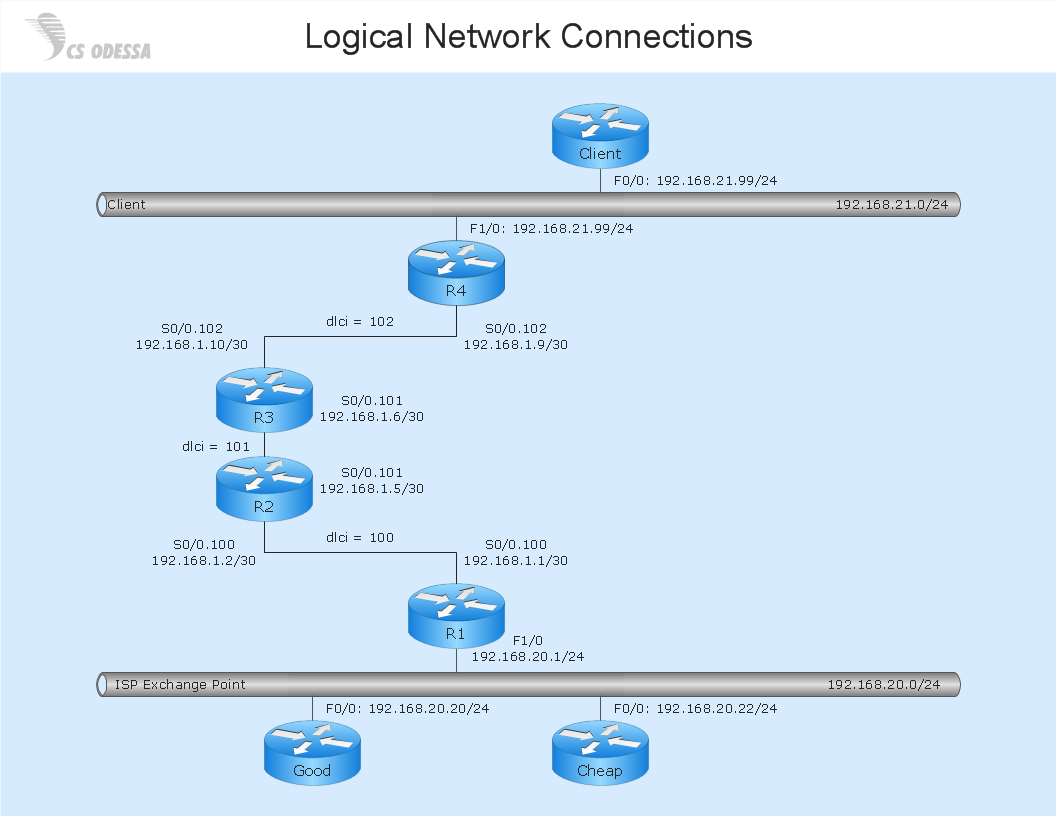
Network Diagram Software Logical Network Diagram
Perfect Network Diagramming Software with examples of LAN Diagrams. ConceptDraw Network Diagram is ideal for network engineers and network designers who need to draw Logical Network diagrams.
Store Layout Software
Creation of Store layout, Shop floor plan, Plans for warehouse and industrial premises, is one of the most important stages in development and design of the store, supermarket or shopping center. Layouts and plans help us clearly imagine our project after implementation, to consider all details, and improve it if necessary. The optimal store layout and design, proper zoning, well thought-out placement of the trade equipment, significantly increase the profit of the shop. ConceptDraw PRO is ideal store layout software that allows easy and professionally create varied Store layouts, Shop designs, Planograms, Designs for сommercial spaces, Cafe floor plans, Restaurant layouts, Office floor plans, House floor plans, and many others layouts thanks to the powerful tools offered by Floor Plans solution included to Building Plans area of ConceptDraw Solution Park. It includes many examples, quick-start templates and predesigned vector stencils libraries. With all this tools you don't need more to be professional artist to create great-looking Store layouts.Food Court
Food courts are one of the most rapidly developing areas of the restaurant business. ConceptDraw PRO diagramming and vector drawing software offers a Food Court solution from the Food and Beverage area with wide capabilities for planning, design, developing and advertising of a Food Court.Cafe Floor Plan. Cafe Floor Plan Examples
Cafe is a perfect place for business meetings, romantic rendezvous, friendly leisures, both adults and children, it is a popular place of relaxation and recreation, staying in which delivers many lively emotions, impressions and memories. Therefore, the opening of the adult or children's cafe, Internet cafe, elite or even thematic cafe is a fine business idea. At the same time when opening a cafe, you need consider a number of nuances and undertake important steps - to make a business plan, choose a popular location, create interesting and comfort cafe interior style and design, draw detailed Cafe floor plan, construct the catchy building if it was not built yet, and make the repairs. On these stages you can enlist the help of professionals, architects and designers, either make themselves your own professional-looking Cafe Floor Plans using the ConceptDraw PRO software. Quick start with ready predesigned Cafe floor plans templates, examples or samples, ready-to-use vector symbols that make you instantly productive in drawing Cafe Floor Plans, Cafe Layouts, Cafe Design Plans.Fishbone Diagram Problem Solving
The Ishikawa diagram, Cause and Effect diagram, Fishbone diagram — all they are the names of one and the same visual method for working with causal connections. Originally invented by Kaoru Ishikawa to control the process quality, the Ishikawa diagram is well proven in other fields of management and personal scheduling, events planning, time management. It is a chart in the form of a fish, whose head is a problem, the fins are variants for its causes. To design easily the Fishbone diagram, you can use a special ConceptDraw PRO vector graphic and diagramming software which contains the powerful tools for Fishbone diagram problem solving offered by Fishbone Diagrams solution for the Management area of ConceptDraw Solution Park.Design Pictorial Infographics. Design Infographics
In the course of recent decades data visualization went through significant development and has become an indispensable tool of journalism, business intelligence and science. The way visual information may be conveyed is not limited simply to static or dynamic representation, it can also be interactive. Infographics can be conditionally divided into several general levels. Primarily, this is level of visualization of information, its interpretation and association on any ground. Second level can be defined as a visualization of knowledge, depiction of thoughts and ideas in the form of images or diagrams. Finally, the level of data visualization, which processes data arrays in charts, enabling the information to be more clearly perceived. You can also identify the main approaches to the creation of infographics: exploratory and narrative. Exploratory method insists on minimalist design in favor of data precision without unnecessary details and is common for scientific researches and anaSWOT Analysis
Most of the data needed for market analysis (demand, prices, volume of sales, etc.) are undefined, and in future are possible their changes as in the worst and the best side. SWOT analysis is effective method for prediction these processes and decision making for organizations that function in a competitive environment. It allows you to see the whole situation, to identify the strengths and weaknesses of organization (advantages and disadvantages), as well as opportunities and threats of external environment. The results of SWOT analysis are the basis for optimization the business processes, for development by the leading specialists in organization of interrelated complex of strategies and competitive activities. ConceptDraw PRO software enhanced with SWOT and TOWS Matrix Diagrams Solution will effectively help you in strategic planning for your company, department, project, in development marketing campaign, in identification of four categories of factors of internal and external environment of organization, and construction professional-looking SWOT and TOWS matrices.- Flow chart Example. Warehouse Flowchart | Organogram Software ...
- Bio Flowchart | Software development with ConceptDraw PRO ...
- Shop Er Diagram
- Furniture Shop Management System Erd Diagrams
- Process Flowchart | Operational Scenario Swim Line Diagram
- System Description For Coffee Shop In Sequence Diagram
- Shop Online Clipart
- Data Flow Online Payment Coffee Machine
- Coffee Shop System Uml State Diagrams
- Grocery Inventory System Entities


