This flow chart sample was drawn on the base on the illustration of the article "Climate change impact on China food security in 2050" from the website of Chinese Academy of Agricultural Sciences .
[caas.cn/ en/ newsroom/ research_ update/ 67347.shtml]
"Food security is a condition related to the ongoing availability of food. ...
According to the Food and Agriculture Organization (FAO), food security "exists when all people, at all times, have physical and economic access to sufficient, safe and nutritious food to meet their dietary needs and food preferences for an active and healthy life". ...
Extreme events, such as droughts and floods, are forecast to increase as climate change takes hold. Ranging from overnight floods to gradually worsening droughts, these will have a range of impacts on the agricultural sector. ...
According to the Climate & Development Knowledge Network report Managing Climate Extremes and Disasters in the Agriculture Sectors: Lessons from the IPCC SREX Report, the impacts will include changing productivity and livelihood patterns, economic losses, and impacts on infrastructure, markets and food security. Food security in future will be linked to our ability to adapt agricultural systems to extreme events." [Food security. Wikipedia]
The flowchart example "Food security assessment" was created using the ConceptDraw PRO diagramming and vector drawing software extended with the Flowcharts solution from the area "What is a Diagram" of ConceptDraw Solution Park.
Flowchart

 Marketing Diagrams
Marketing Diagrams solution extends ConceptDraw DIAGRAM diagramming software with abundance of samples, templates and vector design elements intended for easy graphical visualization and drawing different types of Marketing diagrams and graphs, including Branding Strategies Diagram, Five Forces Model Diagram, Decision Tree Diagram, Puzzle Diagram, Step Diagram, Process Chart, Strategy Map, Funnel Diagram, Value Chain Diagram, Ladder of Customer Loyalty Diagram, Leaky Bucket Diagram, Promotional Mix Diagram, Service-Goods Continuum Diagram, Six Markets Model Diagram, Sources of Customer Satisfaction Diagram, etc. Analyze effectively the marketing activity of your company and apply the optimal marketing methods with ConceptDraw DIAGRAM software.
Example of DFD for Online Store (Data Flow Diagram)


Geo Map - USA - Illinois

Bar Diagrams for Problem Solving. Create economics and financial bar charts with Bar Graphs Solution

 Flowcharts
The Flowcharts solution for ConceptDraw DIAGRAM is a comprehensive set of examples and samples in several varied color themes for professionals that need to represent graphically a process. Solution value is added by the basic flow chart template and shapes' libraries of flowchart notation. ConceptDraw DIAGRAM flow chart creator lets one depict the processes of any complexity and length, as well as design the Flowchart either vertically or horizontally.
Flow chart Example. Warehouse Flowchart


Geo Map — South America — Peru

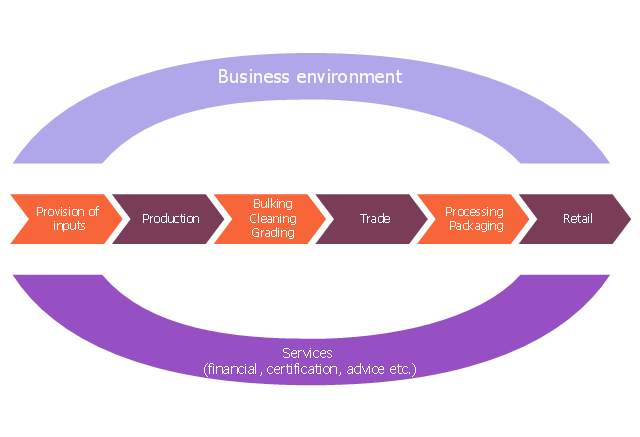
This value chain analysis diagram example illustrates value chain analysis. It was designed on the base of the Wikimedia Commons file: Typical-value-Chain.png. "Typical value chain of agricultural commodities. Belongs to The Organic Business Guide." [commons.wikimedia.org/ wiki/ File:Typical-value-Chain.png]
This file is licensed under the Creative Commons Attribution-Share Alike 3.0 Unported license. [creativecommons.org/ licenses/ by-sa/ 3.0/ deed.en]
"The agricultural value chain concept has been used since the beginning of the millennium, primarily by those working in agricultural development in developing countries. Although there is no universally accepted definition of the term, it normally refers to the whole range of goods and services necessary for an agricultural product to move from the farm to the final customer or consumer." [Agricultural value chain. Wikipedia]
The marketing chart example "Value chain analysis diagram" was created using the ConceptDraw PRO diagramming and vector drawing software extended with the Marketing Diagrams solution from the Marketing area of ConceptDraw Solution Park.
Marketing chart
 Area Charts
Area Charts are used to display the cumulative totals over time using numbers or percentages; or to show trends over time among related attributes. The Area Chart is effective when comparing two or more quantities. Each series of data is typically represented with a different color, the use of color transparency in an object’s transparency shows overlapped areas and smaller areas hidden behind larger areas.
- Flowchart Of Agriculture As A System Of Inputs Processes And Output
- Flow Chart On Agriculture
- Agricultural Pictorial Chart Images
- Chart Related To Agriculture
- Simple Flowchart Of An Agricultural System
- Bar Diagram In Agriculture Examples
- Pictorial Chart Related To Agriculture
- Bar Chart Of Agriculture Production In India
- Area Charts | Education Package | Bar Graph Of Indian Agriculture
- Process Flowchart | Food security assessment - Flowchart | Step ...