This site uses cookies. By continuing to browse the ConceptDraw site you are agreeing to our Use of Site Cookies.

Fishbone Diagram Design Element

ConceptDraw DIAGRAM diagramming and vector drawing software extended with Fishbone Diagrams solution is a perfect tool for software designers and software developers. If you need to create Cause and Effect diagram, Fishbone diagram, Ishikawa diagram from templates and examples, or using the predesigned elements, ConceptDraw DIAGRAM can do this easily.
ConceptDraw DIAGRAM software gives ability to design Fishbone diagrams that identify many possible causes for an effect for problem. Each Fishbone diagram design element included to Fishbone Diagrams library is vector and ready-to-use.

Draw Fishbone Diagram on MAC Software

There are many tools to facilitate the problem solving process. Cause and Effect diagram, or Fishbone diagram is one of them. Fishbone diagram can be constructed following 5 simple steps.
Professional diagramming ConceptDraw DIAGRAM MAC OSX software with Fishbone Diagrams solution helps you make cause and effect analysis, identify the possible causes for an effect for problem solving, draw Fishbone diagram on Mac software aka Ishikawa diagram from brainstorm, templates and examples.

How Do Fishbone Diagrams Solve Manufacturing Problems

How do Fishbone diagrams solve manufacturing problems? Fishbone diagrams are successfully used in various fields of industries and manufacturing to analyze the set of possible causes and their effects. Fishbone diagram provides a process to clearly define the “Effect” and then puts you to thinking about the possible causes, based on the categories of common problems in manufacturing.
ConceptDraw DIAGRAM application extended with Fishbone Diagrams solution lets you construct Fishbone diagrams and represent globally recognized standards for manufacturing 6 Ms and 8 Ms.

Total Quality Management Business Diagram

The Total Quality Management Diagram solution helps you and your organization visualize business and industrial processes. Create Total Quality Management diagrams for business process with ConceptDraw software.

Cause and Effect Analysis

Cause and Effect Analysis - The Seven Management and Planning Tools is a tool for Cause and Effect Analysis that allows users to analyze the root causes for factors that influenced the problem. This diagram is constructed separately for each highly prioritized factor. The Diagram is then used for further formulation of potential actions.
7MP Tools
7MP Tools

Using Fishbone Diagrams for Problem Solving

Problems are obstacles and challenges that one should overcome to reach the goal. They are an inseparable part of any business, and the success of an enterprise often depends on ability to solve all problems effectively. The process of problem solving often uses rational approach, helping to find a suitable solution.
Using Fishbone Diagrams for Problem Solving is a productive and illustrative tool to identify the most important factors causing the trouble. ConceptDraw DIAGRAM extended with Fishbone Diagrams solution from the Management area of ConceptDraw Solution Park is a powerful tool for problem solving with Fishbone Ishikawa diagram graphic method.

Problem solving

Problem Solving - ConceptDraw OFFICT suite is a software for the problem solving. The Seven Management and Planning Tools solution is a set of such tools for investigating complex problems.
These tools are exemplary at organizing research, parsing complex problems, providing a structure for the details, helping managers make decisions, and organizing effective communications in a visual manner that keeps everyone involved.

fishbone diagram, Ishikawa diagram, cause and effect analysis Fishbone Diagrams

fishbone diagram, Ishikawa diagram, cause and effect analysis
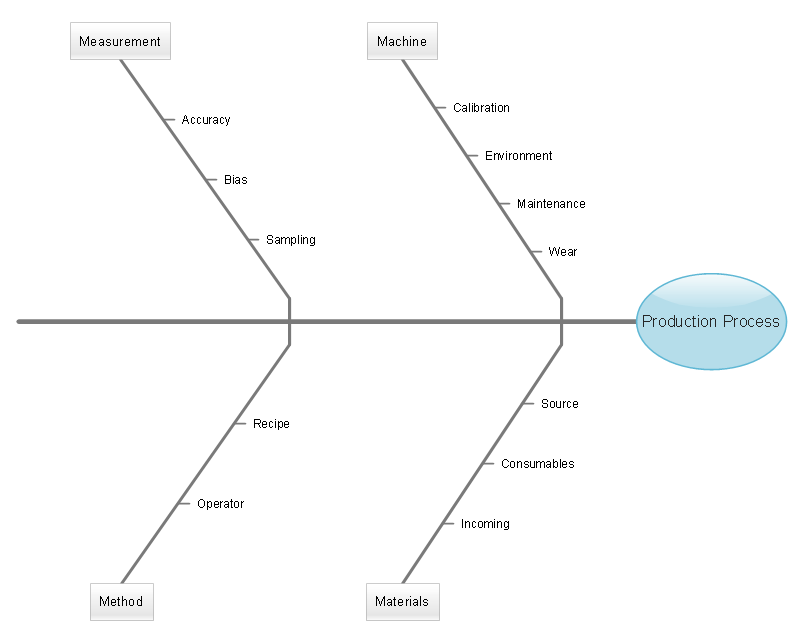
The Fishbone Diagrams solution extends ConceptDraw DIAGRAM software with the ability to easily draw the Fishbone Diagrams (Ishikawa Diagrams) to clearly see the cause and effect analysis and also problem solving. The vector graphic diagrams produced using this solution can be used in whitepapers, presentations, datasheets, posters, and published technical material.

Fishbone Diagram Example

Fishbone Diagram, also referred as Cause and Effect diagram or Ishikawa diagram, is a fault finding and problem solving tool. Construction of Ishikawa diagrams is quite complicated process and has a number of features.
Fishbone Diagrams solution included to ConceptDraw Solution Park contains powerful drawing tools and a lot of examples, samples and templates. Each Fishbone diagram example is carefully thought-out by experts and is perfect source of inspiration for you.