 Business and Finance
Use Business and Finance solution to make professional-looking documents, presentations and websites, business, finance, advertising, and project management illustrations, or any designs that requires clipart of currency, office, business, advertising, management, marketing, people, time, post, contacts, collaboration, etc.
 Fishbone Diagram
Fishbone Diagrams solution extends ConceptDraw PRO software with templates, samples and library of vector stencils for drawing the Ishikawa diagrams for cause and effect analysis.
 Fishbone Diagrams
The Fishbone Diagrams solution extends ConceptDraw PRO v10 software with the ability to easily draw the Fishbone Diagrams (Ishikawa Diagrams) to clearly see the cause and effect analysis and also problem solving. The vector graphic diagrams produced using this solution can be used in whitepapers, presentations, datasheets, posters, and published technical material.
 Audit Flowcharts
Audit flowcharts solution extends ConceptDraw PRO software with templates, samples and library of vector stencils for drawing the audit and fiscal flow charts.
 Accounting Flowcharts
Accounting Flowcharts solution extends ConceptDraw PRO software with templates, samples and library of vector stencils for drawing the accounting flow charts.
Fishbone Diagram Template
A causal model is an abstract concept, that describes the causal mechanisms of a system, by noting certain variables and their influence on each other, in an effort to discover the cause of a certain problem or flaw. This model is presented in diagram form by using a fishbone diagram. ConceptDraw PRO diagramming and vector drawing software enhanced with Fishbone Diagrams solution helps you create business productivity diagrams from Fishbone diagram templates and examples, that provide to start using of the graphic method for the analysis of problem causes. Each predesigned Fishbone Diagram template is ready to use and useful for instantly drawing your own Fishbone Diagram.Good Flow Chart app for Mac
The ConceptDraw PRO is a good flow chart app for Mac. Numerous vector stencils, samples and templates created by designers allows you to draw any type of flowchart.
 IDEF0 Diagrams
IDEF0 Diagrams visualize system models using the Integration Definition for Function Modeling (IDEF) methodology. Use them for analysis, development and integration of information and software systems, and business process modelling.
 Venn Diagrams
Venn Diagrams are actively used to illustrate simple set relationships in set theory and probability theory, logic and statistics, mathematics and computer science, linguistics, sociology, and marketing. Venn Diagrams are also often used to visually summarize the status and future viability of a project.
 Interactive Voice Response Diagrams
Interactive Voice Response Diagrams solution extends ConceptDraw PRO v10 software with samples, templates and libraries of ready-to-use vector stencils that help create Interactive Voice Response (IVR) diagrams illustrating in details a work of interactive voice response system, the IVR system’s logical and physical structure, Voice-over-Internet Protocol (VoIP) diagrams, and Action VoIP diagrams with representing voice actions on them, to visualize how the computers interact with callers through voice recognition and dual-tone multi-frequency signaling (DTMF) keypad inputs.
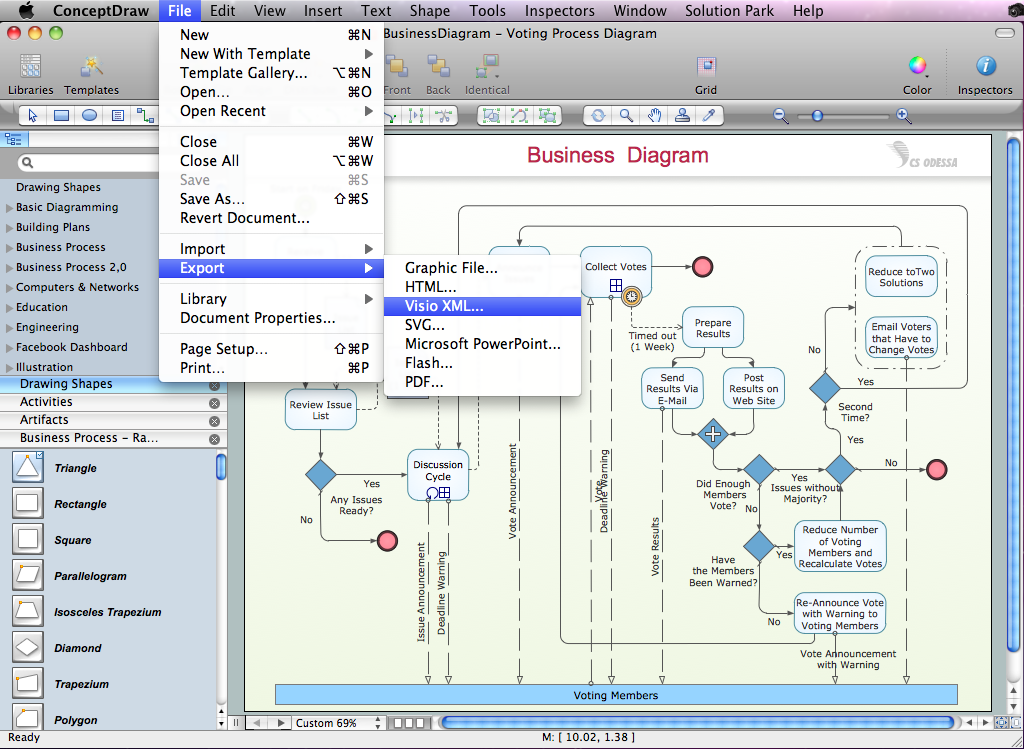
Export from ConceptDraw PRO Document to MS Visio® XML
Once you have created your document in ConceptDraw PRO and you want to share it with your colleagues and friends, who uses MS Visio on their computers, you can easily export your document using ConceptDraw PRO export to Visio XML files (VDX) feature. Now you can share your ConceptDraw documents with MS Visio users.
 Cisco Network Diagrams
Cisco Network Diagrams solution extends ConceptDraw PRO software with samples, templates and libraries of vector stencils for drawing the Cisco computer network diagrams.
 Event-driven Process Chain Diagrams
Event-driven Process Chain (EPC) Diagram is a type of flowchart widely used for modeling in business engineering and reengineering, business process improvement, and analysis. EPC method was developed within the Architecture of Integrated Information Systems (ARIS) framework.
 ConceptDraw Solution Park
ConceptDraw Solution Park collects graphic extensions, examples and learning materials
- Fishbone Diagram Examples Financial Management
- Process Flowchart | Fishbone Diagram | Event-driven Process Chain ...
- Root Cause Analysis Fishbone Diagram Of A Financial Problem
- Soccer (Football) Formation | How to Construct a Fishbone Diagram ...
- Fishbone Diagrams | Business Processes Area | Business and ...
- Entity-Relationship Diagram (ERD) | Process Flowchart | Fishbone ...
- Manufacturing 8 Ms fishbone diagram - Template | Business and ...
- Fishbone Diagrams | Restaurant Floor Plans Software | Business ...
- Fishbone Diagram Problem Solving | Using Fishbone Diagrams for ...
- Diagram Fish Bone Finance
- Process Flowchart | Fishbone Diagram | Event-driven Process Chain ...
- Fishbone Diagrams | Venn Diagram Examples for Problem Solving ...
- Using Fishbone Diagram To Solve Finance Processes
- Fishbone Diagram Example Financial Problem
- Fishbone Diagram Template For Middle School
- Fishbone Diagrams | How Do Fishbone Diagrams Solve ...
- Audit Flowchart Symbols | Fishbone Diagram | Entity-Relationship ...
- Design elements - Run chart | Nursing department finance | Seven ...
- Block Diagram For Financial Management System


