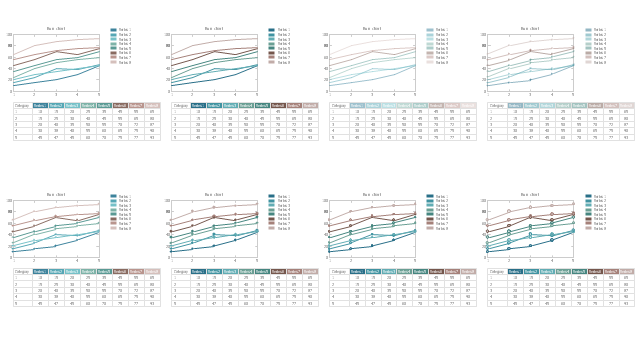
The vector stencils library "Run chart" contains 8 run-sequence plot templates.
Use to design your run-sequence plots with ConceptDraw PRO diagramming and vector drawing software.
"A run chart, also known as a run-sequence plot is a graph that displays observed data in a time sequence. Often, the data displayed represent some aspect of the output or performance of a manufacturing or other business process." [Run chart. Wikipedia]
Run chart is one of the Seven Basic Tools of Quality. [Seven Basic Tools of Quality. Wikipedia]
The example of diagram templates "Design elements - Run chart" is included in the Seven Basic Tools of Quality solution from the Quality area of ConceptDraw Solution Park.
Run-sequence plot templates
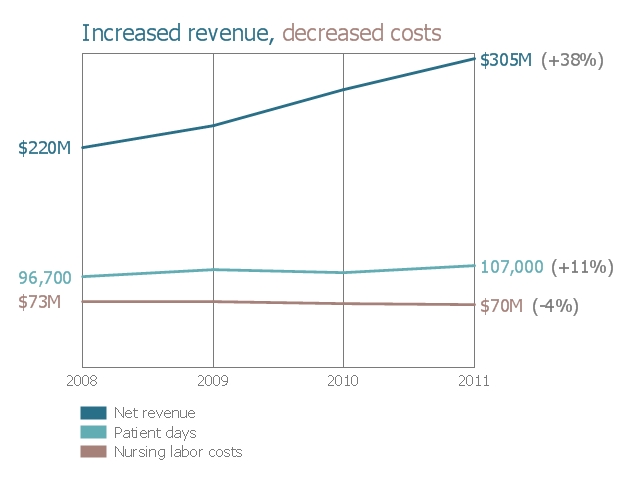
This example was drawn on the base of chart from the webpage "Run your nursing department like a business" on the website of the University of Utah Health Care. "With centralized, global staffing and smaller, flexible nursing pods on each unit, University of Utah Health Care has a healthier financial outlook than ever before, taking care of 11% more patients with 4% less labor—a reduction in nursing labor costs of $100 per patient day."
[healthcare.utah.edu/ nursinginnovation/ 2011/ 10ideas/ one.php]
"A run chart, also known as a run-sequence plot is a graph that displays observed data in a time sequence. Often, the data displayed represent some aspect of the output or performance of a manufacturing or other business process." [Run chart. Wikipedia]
The run chart is one of the Seven Basic Tools of Quality. [Seven Basic Tools of Quality. Wikipedia]
The run chart example "Nursing department finance" was created using the ConceptDraw PRO software extended with the Seven Basic Tools of Quality solution from the Quality area of ConceptDraw Solution Park.
Run chart example
 Seven Basic Tools of Quality
Manage quality control in the workplace, using fishbone diagrams, flowcharts, Pareto charts and histograms, provided by the Seven Basic Tools of Quality solution.
Seven Basic Tools of Quality — Quality Control

Seven Basic Tools of Quality - Fishbone Diagram

Flow Chart Symbols

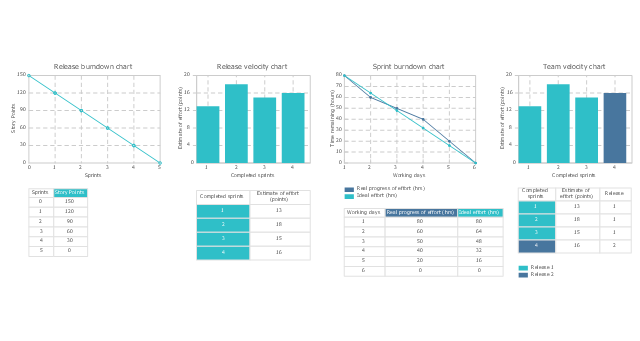
The vector stencils library "Scrum charts" contains 4 templates: release burndown chart, sprint burndown chart, release velocity chart and team velocity chart. Use it to design your agile software development charts and infographics.
"A burn down chart is a graphical representation of work left to do versus time. The outstanding work (or backlog) is often on the vertical axis, with time along the horizontal. That is, it is a run chart of outstanding work. It is useful for predicting when all of the work will be completed. It is often used in agile software development methodologies such as Scrum. However, burn down charts can be applied to any project containing measurable progress over time.
Outstanding work can be represented in terms of either time or story points." [Burn down chart. Wikipedia]
The burn down and velocity charts sample "Design elements - Scrum charts" is included in the Scrum solution from the Project Management area of ConceptDraw Solution Park.
Burn down and velocity charts
The library of vector stencils "Fishbone diagrams" contains 13 symbols for drawing the Ishikawa diagrams using the ConceptDraw PRO diagramming and vector drawing software.
"Ishikawa diagrams were popularized by Kaoru Ishikawa in the 1960s, who pioneered quality management processes in the Kawasaki shipyards, and in the process became one of the founding fathers of modern management.
The basic concept was first used in the 1920s, and is considered one of the seven basic tools of quality control. It is known as a fishbone diagram because of its shape, similar to the side view of a fish skeleton." [Ishikawa diagram. Wikipedia]
"The Seven Basic Tools of Quality is a designation given to a fixed set of graphical techniques identified as being most helpful in troubleshooting issues related to quality. They are called basic because they are suitable for people with little formal training in statistics and because they can be used to solve the vast majority of quality-related issues.
The seven tools are:
(1) Cause-and-effect diagram (also known as the "fishbone" or Ishikawa diagram);
(2) Check sheet;
(3) Control chart;
(4) Histogram;
(5) Pareto chart;
(6) Scatter diagram;
(7) Stratification (alternately, flow chart or run chart)." [Seven Basic Tools of Quality. Wikipedia]
The example "Design elements - Fishbone diagram" is included in the Fishbone Diagrams solution from the Management area of ConceptDraw Solution Park.
Ishikawa diagram symbols

 Business Package for Management
Package intended for professional who designing and documenting business processes, preparing business reports, plan projects and manage projects, manage organizational changes, prepare operational instructions, supervising specific department of an organization, workout customer service processes and prepare trainings for customer service personal, carry out a variety of duties to organize business workflow.
Scatter Chart Examples

- Design elements - Run chart
- Difference Between System Run Chart And System Flow Chart
- Nursing department finance
- Accounting Information Systems Flowchart Symbols | System Run ...
- UML sequence diagram example | Nursing department finance ...
- SWOT Analysis | TOWS Matrix | Bar Graphs | Nursing Fishbone ...
- Seven Basic Tools of Quality - Quality Control | Design elements ...
- Process Flowchart | TQM Software — Build Professional TQM ...
- Probability Quality Control Tools | Seven Basic Tools of Quality ...