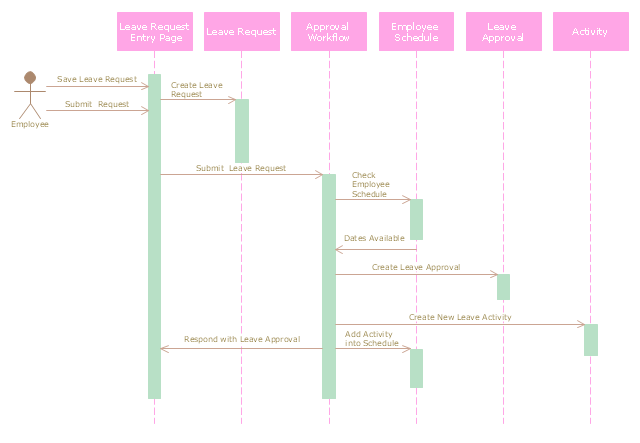
"A sequence diagram is an interaction diagram that shows how processes operate with one another and in what order. It is a construct of a Message Sequence Chart. A sequence diagram shows object interactions arranged in time sequence. It depicts the objects and classes involved in the scenario and the sequence of messages exchanged between the objects needed to carry out the functionality of the scenario. Sequence diagrams are typically associated with use case realizations in the Logical View of the system under development. Sequence diagrams are sometimes called event diagrams, event scenarios." [Sequence diagram. Wikipedia]
This UML sequence diagram example was created using the ConceptDraw PRO diagramming and vector drawing software extended with the Rapid UML solution from the Software Development area of ConceptDraw Solution Park.
This UML sequence diagram example was created using the ConceptDraw PRO diagramming and vector drawing software extended with the Rapid UML solution from the Software Development area of ConceptDraw Solution Park.
UML sequence diagram
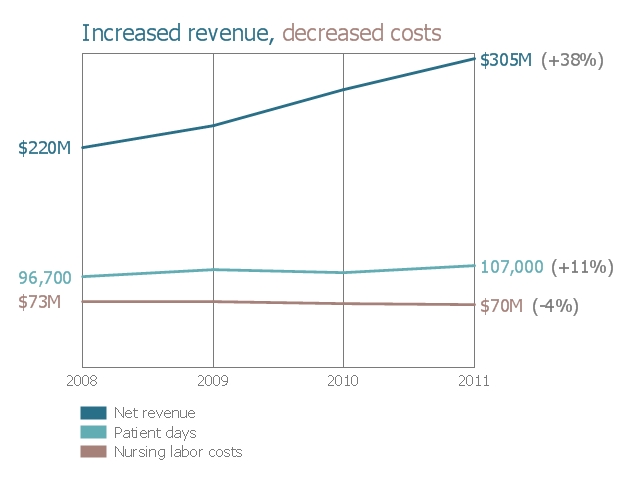
This example was drawn on the base of chart from the webpage "Run your nursing department like a business" on the website of the University of Utah Health Care. "With centralized, global staffing and smaller, flexible nursing pods on each unit, University of Utah Health Care has a healthier financial outlook than ever before, taking care of 11% more patients with 4% less labor—a reduction in nursing labor costs of $100 per patient day."
[healthcare.utah.edu/ nursinginnovation/ 2011/ 10ideas/ one.php]
"A run chart, also known as a run-sequence plot is a graph that displays observed data in a time sequence. Often, the data displayed represent some aspect of the output or performance of a manufacturing or other business process." [Run chart. Wikipedia]
The run chart is one of the Seven Basic Tools of Quality. [Seven Basic Tools of Quality. Wikipedia]
The run chart example "Nursing department finance" was created using the ConceptDraw PRO software extended with the Seven Basic Tools of Quality solution from the Quality area of ConceptDraw Solution Park.
Run chart example
HelpDesk
How To Create a PERT Chart

- Example Of Time And Sequence Chart
- Examples Of Time And Sequence Chart With The Aid Of A Diagrams
- ATM Sequence diagram | Timeline Diagrams | Line Graphs | Time ...
- Schedule pie chart - Daily action plan | UML sequence diagram ...
- Time Sequence Diagram
- Sequence Diagram Tool | Diagramming Software for designing UML ...
- Sequence Diagram Example
- Time Sequence Diagram Example
- Time Sequenced Bar Chart
- Order processing center - UML sequence diagram | Sequence ...
- Design elements - Time series charts | Line Chart Examples | Line ...
- UML Sequence Diagram Example . SVG Vectored UML Diagrams ...
- Design elements - Run chart | Nursing department finance | Nursing ...
- How to Create a Gantt Chart for Your Project | UML sequence ...
- Time Series Dashboard | Time series charts - Vector stencils library ...
- Sample Time Lines
- Bar chart - Template
- Design elements - UML timing diagrams | UML sequence diagram ...
- Concept Draw Sequence Diagram Example
- UML Sequence Diagram | Diagramming Software for designing ...