"In elementary algebra, a quadratic equation (from the Latin quadratus for "square") is any equation having the form
ax^2+bx+c=0
where x represents an unknown, and a, b, and c are constants with a not equal to 0. If a = 0, then the equation is linear, not quadratic. The constants a, b, and c are called, respectively, the quadratic coefficient, the linear coefficient and the constant or free term.
Because the quadratic equation involves only one unknown, it is called "univariate". The quadratic equation only contains powers of x that are non-negative integers, and therefore it is a polynomial equation, and in particular it is a second degree polynomial equation since the greatest power is two.
Quadratic equations can be solved by a process known in American English as factoring and in other varieties of English as factorising, by completing the square, by using the quadratic formula, or by graphing." [Quadratic equation. Wikipedia]
The flowchart example "Solving quadratic equation algorithm" was created using the ConceptDraw PRO diagramming and vector drawing software extended with the Mathematics solution from the Science and Education area of ConceptDraw Solution Park.
Basic Diagramming
Mathematics is an exact science, which studies the values, spatial forms and quantitative relations. It is a science, in which is built large number of various diagrams, charts and graphs that present the material in a clear, visual and colorful form, help to analyze the information and to make certain conclusions. A diagram is a graphical representation of data using the linear segments or geometric shapes, which allows to evaluate the ratio of several values. Depending on the types of solved tasks are used the diagrams of different kinds. A graph is a diagram that shows quantitative dependencies of various processes using the curves. ConceptDraw DIAGRAM is a powerful intelligent and multifunctional vector engine for drawing different Mathematical diagrams and graphs, Mathematical illustrations, complex and simple Diagram mathematics, Flowcharts of equation solving process, Line graphs, Scatter plots, Histograms, Block diagrams, Bar charts, Divided bar diagrams, Pie charts, Area charts, Circular arrows diagrams, Venn diagrams, Bubble diagrams, Concept maps, and many others.
 Mathematics
Mathematics solution extends ConceptDraw DIAGRAM software with templates, samples and libraries of vector stencils for drawing the mathematical illustrations, diagrams and charts.
Flowchart Maker
A flowchart maker is a software showing the interaction, sequence or organization. It also known as flowchart maker or ConceptDraw DIAGRAM standard supplied with different types of symbol collections: standard symbols, branded set and authored. It used strictly for enhancing scientific or business documents with abstract explanatory pictures. Business graphic applications show a special knowledge representations and include many features for creating schematic pictures. These graphic tools are known as flowchart maker or flowchart maker software.Mathematical Diagrams
ConceptDraw DIAGRAM diagramming and vector drawing software extended with Mathematics solution from the Science and Education area is the best for creating: mathematical diagrams, graphics, tape diagrams various mathematical illustrations of any complexity quick and easy. Mathematics solution provides 3 libraries: Plane Geometry Library, Solid Geometry Library, Trigonometric Functions Library.Types of Flowchart - Overview
When designing a process or an instruction in clear and understandable way, you should consider creating a flowchart. You can avoid spending a lot of time understanding complex concepts as they get clear with different diagrams. The flowcharts are very popular diagram type, they are useful at different fields from the description business processes to the presentation of cooking recipes. Basic Flowchart, Business Process Modeling Diagram, Process Flowchart, Cross Functional Flowchart, Procedure Flowchart, Data Flow Diagram, IDEF Flowchart, SDL Diagram, Workflow Diagram, Document Flowchart, Program Flowchart, Value Stream Map, System Flowchart, Highlight Flowchart, Sales Flowchart are the main types flowchart. The ConceptDraw DIAGRAM is one of the professional applications which has great advantages and using which you can create different types of Flowcharts easy and fast. Try to draw an illustrative and comprehensible diagram in ConceptDraw DIAGRAM describing the processes instead of writing complex long text and make sure how it is convenient. Visio is expensive, and if you use it in a team environment, these costs are compounded. ConceptDraw DIAGRAM is an affordable alternative to Visio and luckily, it comes with a team plan. ConceptDraw DIAGRAM can import and export Visio files, so Mac users can collaborate with PC users stuck on Microsoft's software.
Basic Circles Venn Diagram. Venn Diagram Example
Venn Diagrams visualize all possible logical relations between several sets and are widely used in mathematics, logic, statistics, marketing, sociology, etc. This Venn Diagram shows the relative complement of the set A with respect to the set B. It is the set of the elements in B, but not in A. In other words it is the set-theoretic difference B-A.Draw Fishbone Diagram on MAC Software
The problem solving and decision-making processes are closely linked and crucial for the business and life. There are many tools and techniques for facilitating and improvement these processes, and also enhancement the quality of accepted decisions. One of them is Fisbone Diagram or Cause and Effect diagram. For its construction, you need first define the problem which you need to solve (existing or potential), write it into rectangular and draw to it a horizontal line - a “fish spine”. Then define general types of possible causes like Persons, Materials, Methods, Machinery, Measurements or Environment, and attach them to “spine”. Start brainstorming the possible reasons of failure and connect them to the branches. Professional diagramming ConceptDraw DIAGRAM MAC OSX software offers the Fishbone Diagrams solution which contains templates, samples, and ready Fishbone design objects. Use of them lets effectively identify the possible causes for an effect, realize successfully cause and effect analysis, and instantly draw Fishbone diagram on Mac software.Simple Drawing Applications for Mac
ConceptDraw gives the ability to draw simple diagrams like flowcharts, block diagrams, bar charts, histograms, pie charts, divided bar diagrams, line graphs, area charts, scatter plots, circular arrows diagrams, Venn diagrams, bubble diagrams, concept maps, and others.
 Scatter Diagrams
The Scatter Diagrams solution extends ConceptDraw DIAGRAM functionality with templates, samples, and a library of vector stencils that make construction of a Scatter Plot easy. The Scatter Chart Solution makes it easy to design attractive Scatter Diagrams used in various fields of science, work, and life activities. ConceptDraw DIAGRAM lets you enter the data to the table and construct the Scatter Plot Graph automatically according to these data.
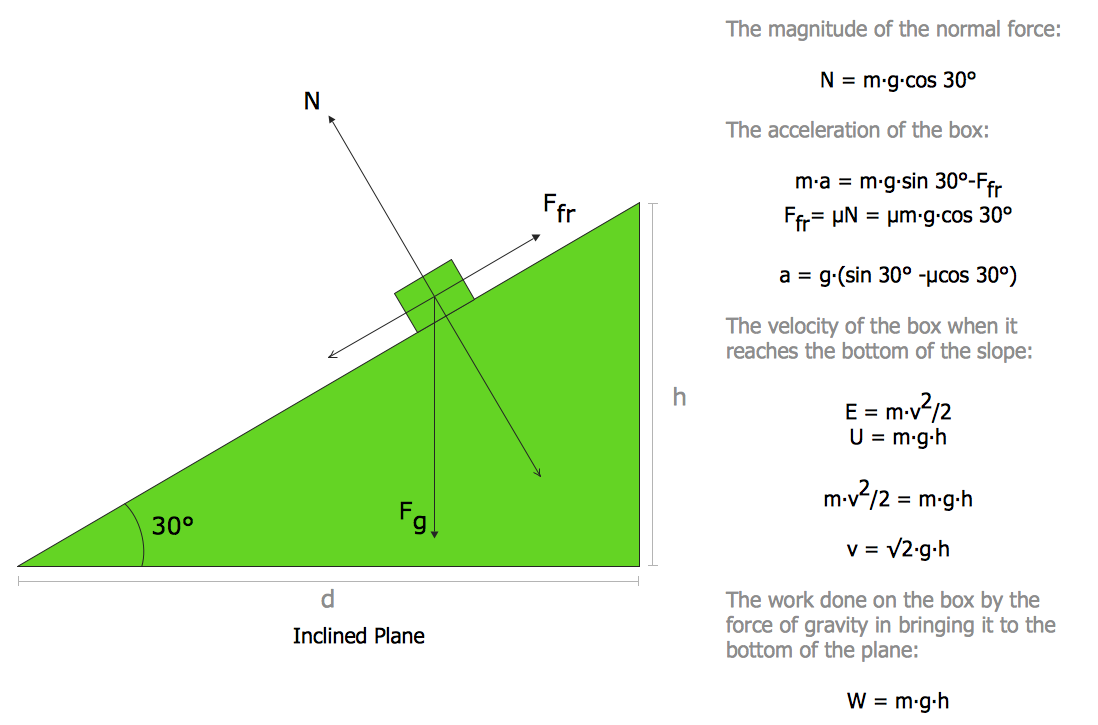
Physics Diagrams
ConceptDraw DIAGRAM diagramming and vector drawing software extended with Physics solution from the Science and Education area is the best for creating: physics diagrams, pictures which describe various physical facts and experiments, illustrations of various electrical, mechanical and optic processes, of any complexity quick and easy.Column Chart Template
Column chart templates from ConceptDraw collection can help you find the best visual depiction for you data. You can easily modify column chart templates according to data you want to visualize."In mathematics, the Euclidean algorithm, or Euclid's algorithm, is a method for computing the greatest common divisor (GCD) of two (usually positive) integers, also known as the greatest common factor (GCF) or highest common factor (HCF). ...
The GCD of two positive integers is the largest integer that divides both of them without leaving a remainder (the GCD of two integers in general is defined in a more subtle way).
In its simplest form, Euclid's algorithm starts with a pair of positive integers, and forms a new pair that consists of the smaller number and the difference between the larger and smaller numbers. The process repeats until the numbers in the pair are equal. That number then is the greatest common divisor of the original pair of integers.
The main principle is that the GCD does not change if the smaller number is subtracted from the larger number. ... Since the larger of the two numbers is reduced, repeating this process gives successively smaller numbers, so this repetition will necessarily stop sooner or later - when the numbers are equal (if the process is attempted once more, one of the numbers will become 0)." [Euclidean algorithm. Wikipedia]
The flowchart example "Euclidean algorithm" was created using the ConceptDraw PRO diagramming and vector drawing software extended with the Mathematics solution from the Science and Education area of ConceptDraw Solution Park.
HelpDesk
How to Purchase ConceptDraw Products for Academic/Nonprofit Institutions
CS Odessa offers special academic and non-profit pricing. We provide our academic customers with the incentive individual pricing, based on their specific academic scenario or requirements.The vector stencils library "AWS Database" contains 30 Amazon Web Services database icons: Amazon DynamoDB symbols, Amazon Relational Database Service symbols, Amazon ElasticCache symbols, Amazon SimpleDB symbols, Amazon Redshift symbols.
Use it to draw AWS architecture diagrams of your cloud service.
The symbols example "AWS Database - Vector stencils library" was created using the ConceptDraw PRO diagramming and vector drawing software extended with the AWS Architecture Diagrams solution from the Computer and Networks area of ConceptDraw Solution Park.
- Solving quadratic equation algorithm - Flowchart | Draw A Flowchart ...
- Solving quadratic equation algorithm - Flowchart | Program And ...
- Solving quadratic equation algorithm - Flowchart | Basic Network ...
- Solving quadratic equation algorithm - Flowchart | Basic Network ...
- Solving quadratic equation algorithm - Flowchart | Draw Flowchart ...
- Solving quadratic equation algorithm - Flowchart | Drow A Flow ...
- Solving quadratic equation algorithm - Flowchart | Basic Network ...
- Solving quadratic equation algorithm - Flowchart | Basic Network ...
- Network Community Structure. Computer and Network Examples ...
- Solving quadratic equation algorithm - Flowchart | Mathematics ...
- Solving quadratic equation algorithm - Flowchart | Mathematics ...
- Solving quadratic equation algorithm - Flowchart | The Building ...
- Euclidean algorithm - Flowchart | Solving quadratic equation ...
- Basic Network Diagram | Project On Quadratic Equation On Chart
- Solving quadratic equation algorithm - Flowchart | Basic Flowchart ...
- Solving quadratic equation algorithm - Flowchart | | Euclidean ...
- Flowchart Maker | Solving quadratic equation algorithm - Flowchart ...
- Solving quadratic equation algorithm - Flowchart | Fully Connected ...
- Euclidean algorithm - Flowchart | Algorithm To Find The Largest Of ...











-aws-database---vector-stencils-library.png--diagram-flowchart-example.png)
