 SWOT Analysis
SWOT and TOWS Matrix Diagrams solution extends ConceptDraw DIAGRAM and ConceptDraw MINDMAP software with features, templates, samples and libraries of vector stencils for drawing SWOT and TOWS analysis matrices and mind maps.
"SWOT Analysis.
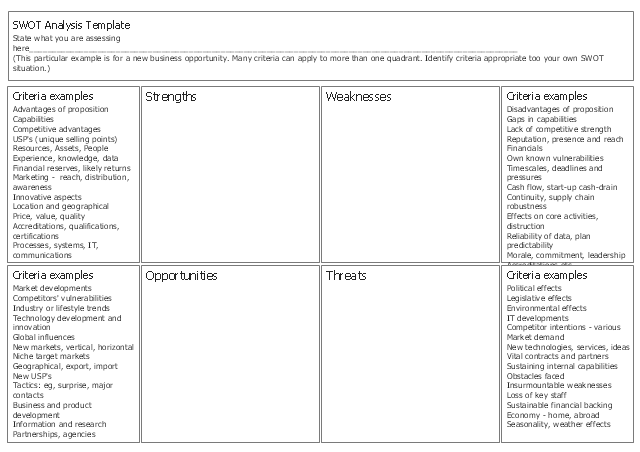
A way to identify and analyze a company's goals by assessing its strength, weaknesses, opportunities, and threats. An advantage to SWOT analysis is that it separates internal factors (strengths and weaknesses) from external ones (opportunities and threats). This allows the company to match what it could do in theory with what is possible in reality. Another advantage is the fact that conducting SWOT analysis is straightforward if the company conducting it is honest with itself." [financial-dictionary.thefreedictionary.com/ SWOT+Analysis]
This form template "New business opportunity SWOT analysis matrix" for the ConceptDraw PRO diagramming and vector drawing software is included in the SWOT Analysis solution from the Management area of ConceptDraw Solution Park.
SWOT matrix template
SWOT Matrix Template

SWOT Template

 Business and Finance
Use Business and Finance solution to make professional-looking documents, presentations and websites, business, finance, advertising, and project management illustrations, or any designs that requires clipart of currency, office, business, advertising, management, marketing, people, time, post, contacts, collaboration, etc.
 Business Productivity Area
Business Productivity Solutions extend ConceptDraw products with tools for making presentations, conducting meetings, preparing documents, brainstorming, or building new strategies.
 ConceptDraw Solution Park
ConceptDraw Solution Park collects graphic extensions, examples and learning materials
 Accounting Flowcharts
Accounting Flowcharts solution extends ConceptDraw DIAGRAM software with templates, samples and library of vector stencils for drawing the accounting flow charts.
 Value Stream Mapping
Value stream mapping solution extends ConceptDraw DIAGRAM software with templates, samples and vector stencils for drawing the Value Stream Maps (VSM) in lean manufacturing practice.
 Fishbone Diagram
Fishbone Diagrams solution extends ConceptDraw DIAGRAM software with templates, samples and library of vector stencils for drawing the Ishikawa diagrams for cause and effect analysis.
 Entity-Relationship Diagram (ERD)
Entity-Relationship Diagram (ERD) solution extends ConceptDraw DIAGRAM software with templates, samples and libraries of vector stencils from drawing the ER-diagrams by Chen's and crow’s foot notations.
 Marketing
This solution extends ConceptDraw DIAGRAM and ConceptDraw MINDMAP with Marketing Diagrams and Mind Maps (brainstorming, preparing and holding meetings and presentations, sales calls).
 Cisco Network Diagrams
Cisco Network Diagrams solution extends ConceptDraw DIAGRAM with the best characteristics of network diagramming software. Included samples, templates and libraries of built-in standardized vector Cisco network icons and Cisco symbols of computers, network devices, network appliances and other Cisco network equipment will help network engineers, network designers, network and system administrators, as well as other IT professionals and corporate IT departments to diagram efficiently the network infrastructure, to visualize computer networks topologies, to design Cisco computer networks, and to create professional-looking Cisco Computer network diagrams, Cisco network designs and schematics, Network maps, and Network topology diagrams in minutes.
 Seven Management and Planning Tools
Seven Management and Planning Tools solution extends ConceptDraw DIAGRAM and ConceptDraw MINDMAP with features, templates, samples and libraries of vector stencils for drawing management mind maps and diagrams.
 Cross-Functional Flowcharts
Cross-functional flowcharts are powerful and useful tool for visualizing and analyzing complex business processes which requires involvement of multiple people, teams or even departments. They let clearly represent a sequence of the process steps, the order of operations, relationships between processes and responsible functional units (such as departments or positions).
- SWOT analysis diagram - Template
- SWOT Analysis | Business and Finance | ConceptDraw Solution Park |
- New business opportunity SWOT analysis matrix - Template portrait ...
- SWOT Analysis | Business and Finance | Fishbone Diagram |
- SWOT Sample in Computers | SWOT Analysis | Fishbone Diagram |
- SWOT Analysis | SWOT Sample in Computers ... - Conceptdraw.com
- Swot Analysis Examples | SWOT analysis matrix diagram templates ...
- SWOT Analysis | Business and Finance | Correlation Dashboard |
- New business opportunity SWOT analysis matrix - Template ...
- SWOT Analysis | Holiday | ConceptDraw Solution Park |
- Swot Analysis Examples for Mac OSX - Conceptdraw.com
- SWOT Analysis | Holiday | Cross-Functional Flowcharts |
- Mind Maps for Business - SWOT Analysis | Decision Making ...
- SWOT Sample in Computers | Swot Analysis Examples | Swot ...
- Swot Analysis Strengths, Weaknesses , Opportunities, and Threats ...
- How to Make SWOT Analysis in a Word Document | SWOT Template ...
- Ansoff's Product/Market matrix | SWOT analysis matrix diagram ...
- Computers and Communications | Artwork | Business and Finance |
- How to Make SWOT Analysis in a Word Document | SWOT Analysis ...
- SWOT Analysis | New business opportunity SWOT analysis matrix ...