This site uses cookies. By continuing to browse the ConceptDraw site you are agreeing to our Use of Site Cookies.

Express-G Diagram

The vector stencils library from the solution Information Model Diagrams contains specific data type symbols of the EXPRESS-G notation such as entity data type symbols, simple data type symbols, enumeration data type symbols, defined data type symbols, select data type symbols and specific attribute symbols for ConceptDraw DIAGRAM diagramming and vector drawing software. The Information Model Diagrams solution is contained in the Software Development area of ConceptDraw Solution Park.

block diagram, function blocks Block Diagrams

block diagram, function blocks
Block diagrams solution extends ConceptDraw DIAGRAM software with templates, samples and libraries of vector stencils for drawing the block diagrams.

ER Diagram Programs for Mac

ConceptDraw DIAGRAM compatible Mac OS X software extended with powerful Entity-Relationship Diagram (ERD) Solution from the Software Development Area for ConceptDraw Solution Park is one of the famous ER Diagram Programs for Mac. It gives the perfect ability to draw ER diagrams for visually describing databases with Chen's and Crow's Foot notation icons.

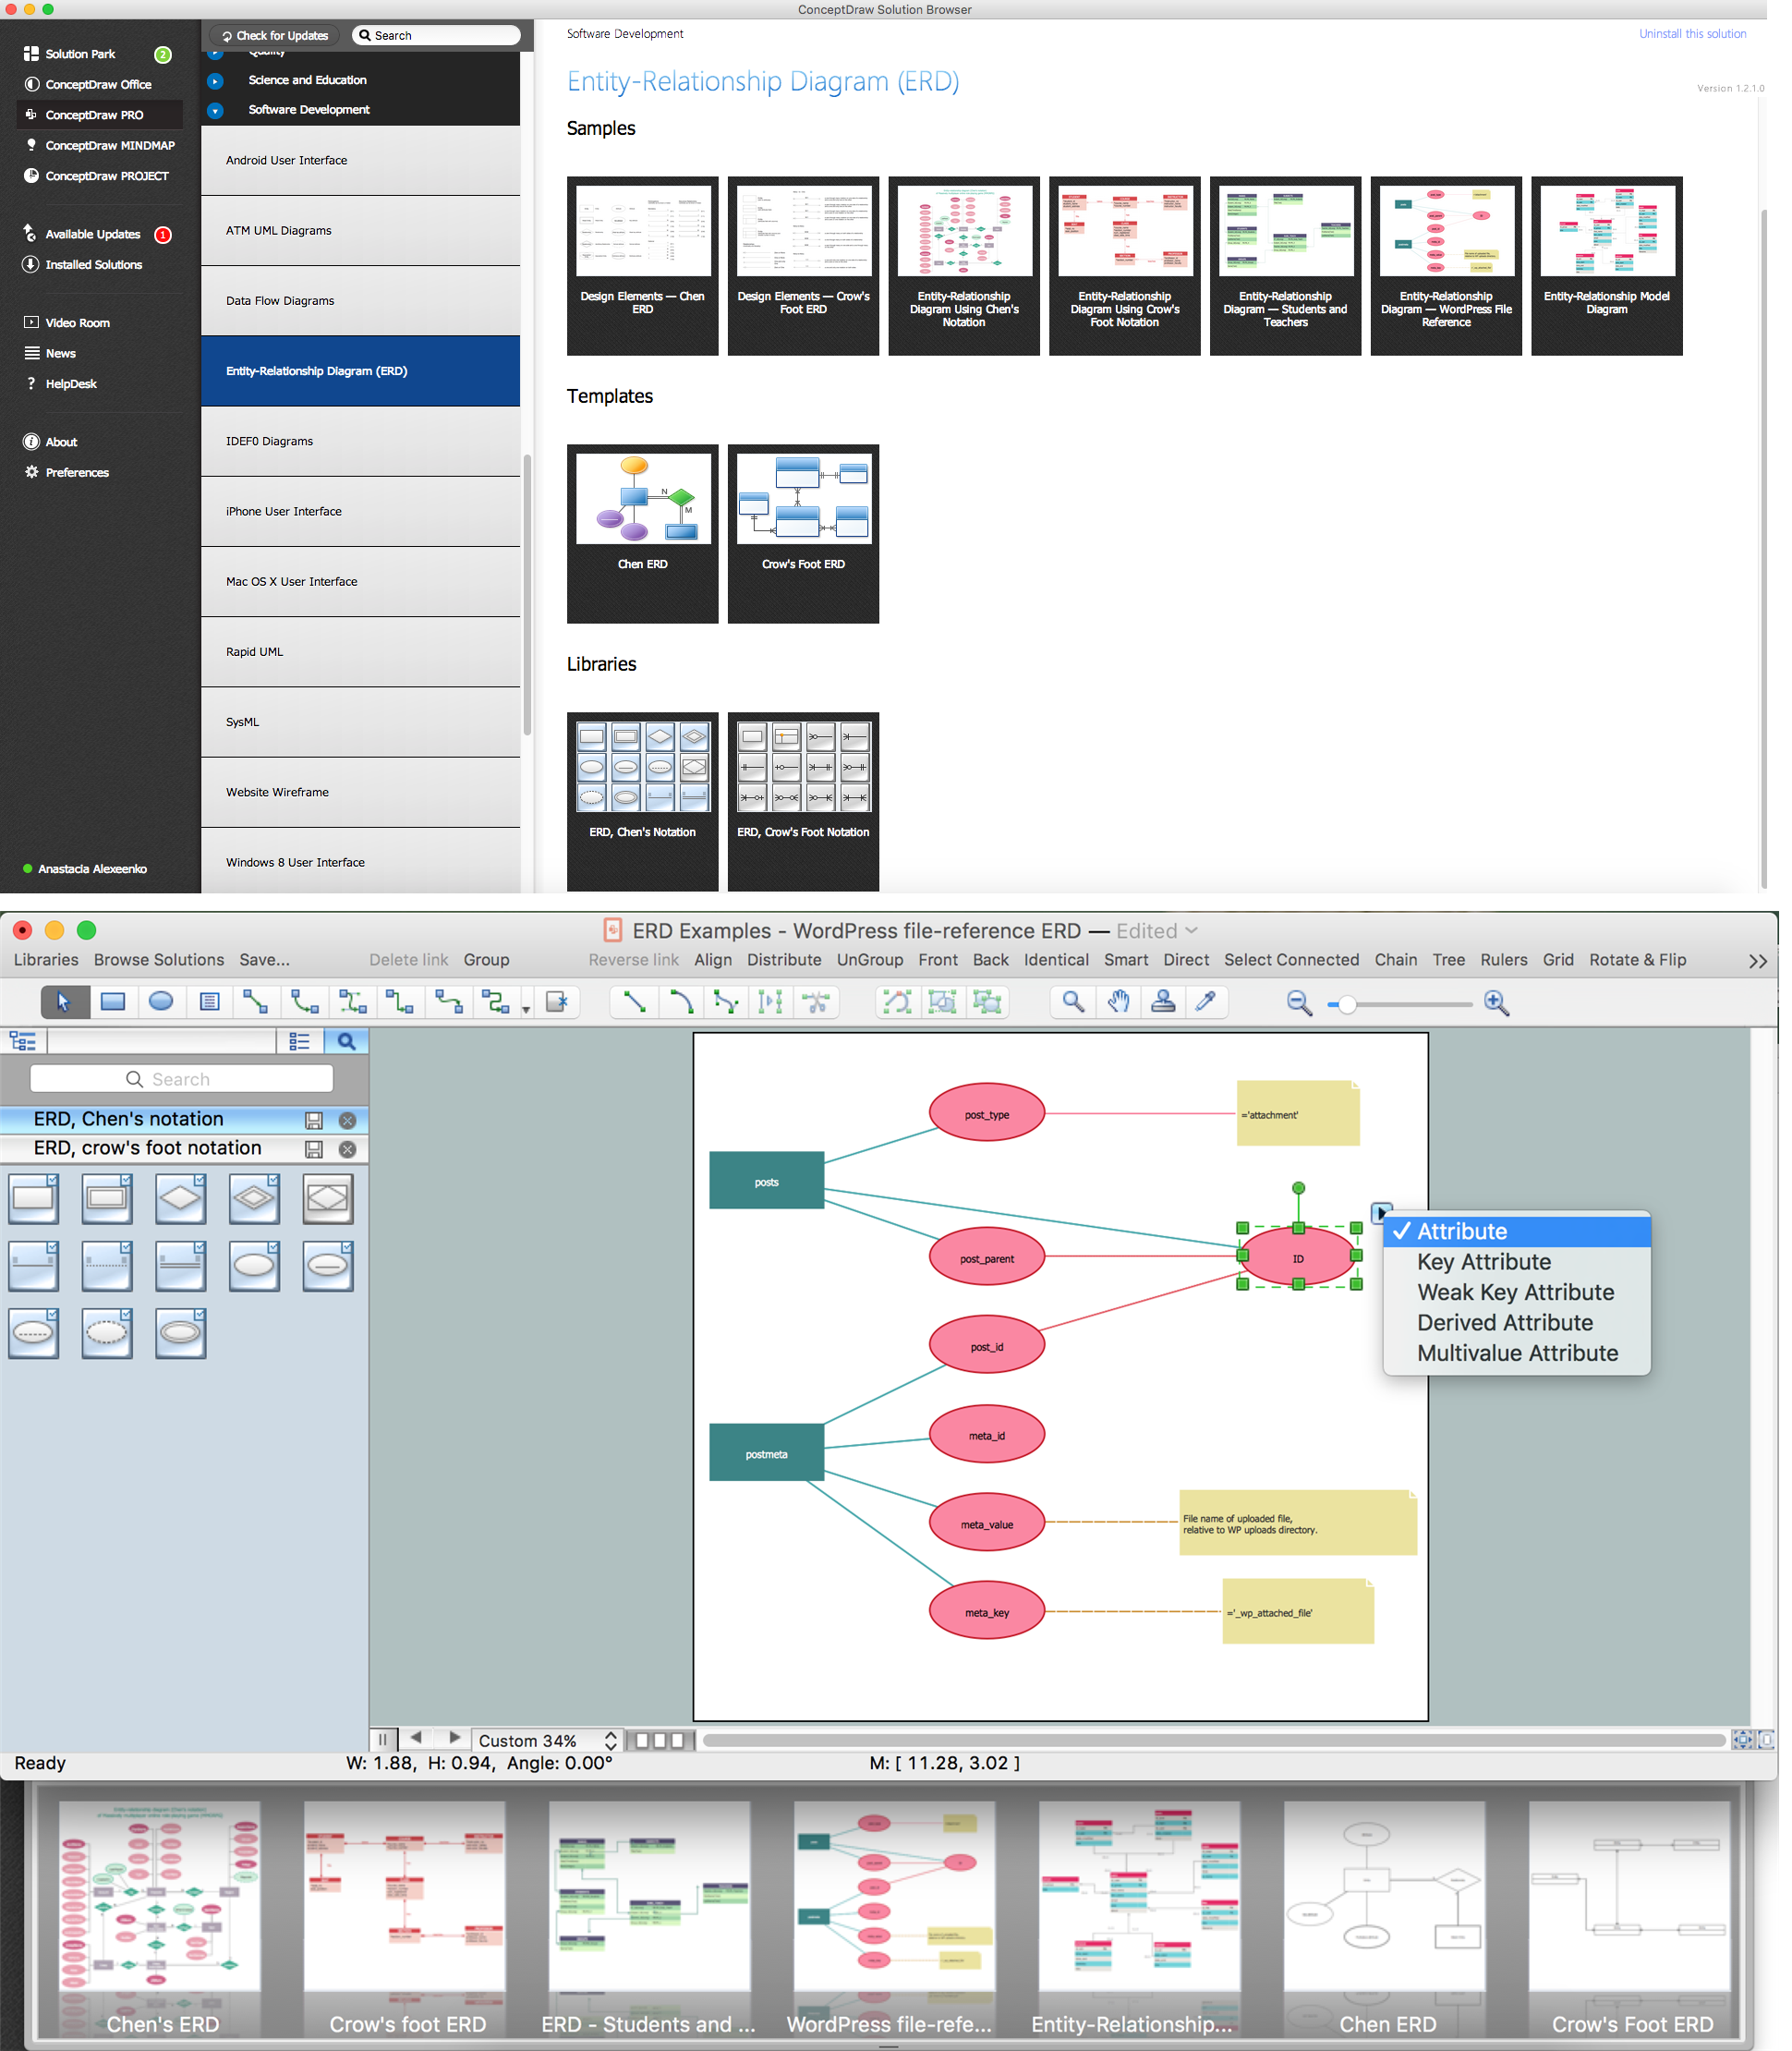
Entity-Relationship Diagram (ERD) with ConceptDraw DIAGRAM

Entity-Relationship Diagram (ERD) serves for detailed description of structures and databases. An ERD represents a diagram made up mainly of rectangular blocks (for entities, or data) linked with relationships. The links between the blocks describe relations between these entities. There are three types of relationships: one-to-one,
one-to-many, many-to-many.
Draw Entity-Relationship Diagrams (ERD) easily with ConceptDraw extended with Entity-Relationship Diagram (ERD) Solution from the Software Development Area. Use ERD software to create ER diagram.
How to Build an Entity Relationship Diagram (ERD)

Multi Layer Venn Diagram. Venn Diagram Example

To visualize the relationships between subsets of the universal set you can use Venn diagrams. To construct one, you should divide the plane into a number of cells using n figures. Each figure in the chart represents a single set of, and n is the number of represented sets. Splitting is done in a way that there is one and only one cell for any set of these figures, the points of which belong to all the figures from the set and do not belong to others. The plane on which the figures are represented, is the universal set U. Thus, the point which does not belong to any of the figures, belongs only to U.

ER Diagram Styles

When creating ER diagrams, you can apply different color ER diagram styles and also notation styles. ConceptDraw DIAGRAM enhanced with Entity-Relationship Diagram (ERD) Solution gives the ability to draw visual and attractive ER Diagrams using the style icons from Crow’s Foot notation and Chen's notation professionally designed and offered by ERD Chen's Notation and ERD Crow’s Foot Notation libraries.

PROBLEM ANALYSIS. Root Cause Analysis Tree Diagram

Root Cause Analysis Tree Diagram. Use the Root Cause Diagram to perform visual root cause analysis. Root Cause Analysis Tree Diagram is constructed separately for each highly prioritized factor. The goal of this is to find the root causes for the factor and list possible corrective action.
ConceptDraw Office suite is a software for problem analysis.
7MP Tools
7MP Tools

Software Diagram Examples and Templates

ConceptDraw DIAGRAM is a powerful tool for business and technical diagramming.
Software Development area of ConceptDraw Solution Park provides 5 solutions:
Data Flow Diagrams, Entity-Relationship Diagram (ERD), Graphic User Interface, IDEFO Diagrams, Rapid UML.

The Best Flowchart Software Available

ConceptDraw gives the ability to draw Flowchart documents. Flowcharts solutionis a powerful tool that extends ConceptDraw application for drawing business flowcharts.
ConceptDraw DIAGRAM vector diagramming and business graphics software enhanced with with templates, green and interactive flowchart makers, samples and stencil libraries from ConceptDraw Solution Park which all focused to help with drawing flowcharts, block diagrams, bar charts, histograms, pie charts, divided bar diagrams, line graphs, area charts, scatter plots, circular arrows diagrams, Venn diagrams, bubble diagrams, concept maps, and others.
HelpDesk

How to Draw a Pyramid Diagram

Pyramid diagram (triangle diagram) is used to represent data, which have hierarchy and basics. Due to the triangular form of a diagram, each pyramid section has a different width. The width of the segment shows the level of its hierarchy. Typically, the top of the pyramid is the data that are more important than the base data. A pyramid scheme can be used to show proportional and hierarchical relationships between some logically related items, such as departments within an organization, or successive elements of any process. This type of diagram is often used in marketing to display hierarchically related data, but it can be used in a variety of situations. ConceptDraw DIAGRAM allows you to make a pyramid diagram, quickly and easily using special libraries.