This site uses cookies. By continuing to browse the ConceptDraw site you are agreeing to our Use of Site Cookies.

Transport hazard pictograms, transport ghs pictograms download, transport hazard symbols Transport Hazard Pictograms

Transport hazard pictograms, transport ghs pictograms download, transport hazard symbols
Transport Hazard Pictograms solution includes large variety of specially developed samples with transport hazard symbols and pictograms, and the whole set of predesigned vector transport GHS pictograms download and used with ease from the Transport Hazard Pictograms library. Apply them for quick designing professional-looking infographics and diagrams, use them to create warning signboards and announcements on all stages of the transportation process, to place them on the transport vehicles and warehouses of transportation companies, at the transport documentation and on the websites of transport and logistics companies.

Sample Pictorial Chart. Sample Infographics

Sample Pictorial Chart - Pictorial Infographics solution provides easy-to-use design infographics drawing tools, large collection of different sample infographics and infograms, sample pictorial chart and templates to be filled in, and 10 libraries with great quantity of predesigned vector pictograms.
Use Pictorial Infographics solution to draw your own design pictorial infographics documents quick and easy.

ghs pictograms, hazardous symbols, pictogram hazard, hazard pictograms, hazard communication pictograms, OSHA HAZCOM Standard GHS Hazard Pictograms

ghs pictograms, hazardous symbols, pictogram hazard, hazard pictograms, hazard communication pictograms, OSHA HAZCOM Standard
GHS Hazard Pictograms solution contains the set of predesigned standard GHS pictograms, Hazardous symbols, and Hazard communication pictograms, approved and agreed by UN in Globally Harmonized System of Classification and Labelling of Chemicals (GHS). They can be used for quick and simple designing accurate and professional-looking infographics, diagrams, warning announcements, signboards, posters, precautionary declarations, regulatory documents, and for representing the main items of OSHA HAZCOM Standard.

Sport pictograms. Olympic Games

The Winter Sports solution from Sport Area of ConceptDraw Solution Park contains winter sports pictograms you may use illustrating any kind of material about Olympic Games or any other sport competitions.

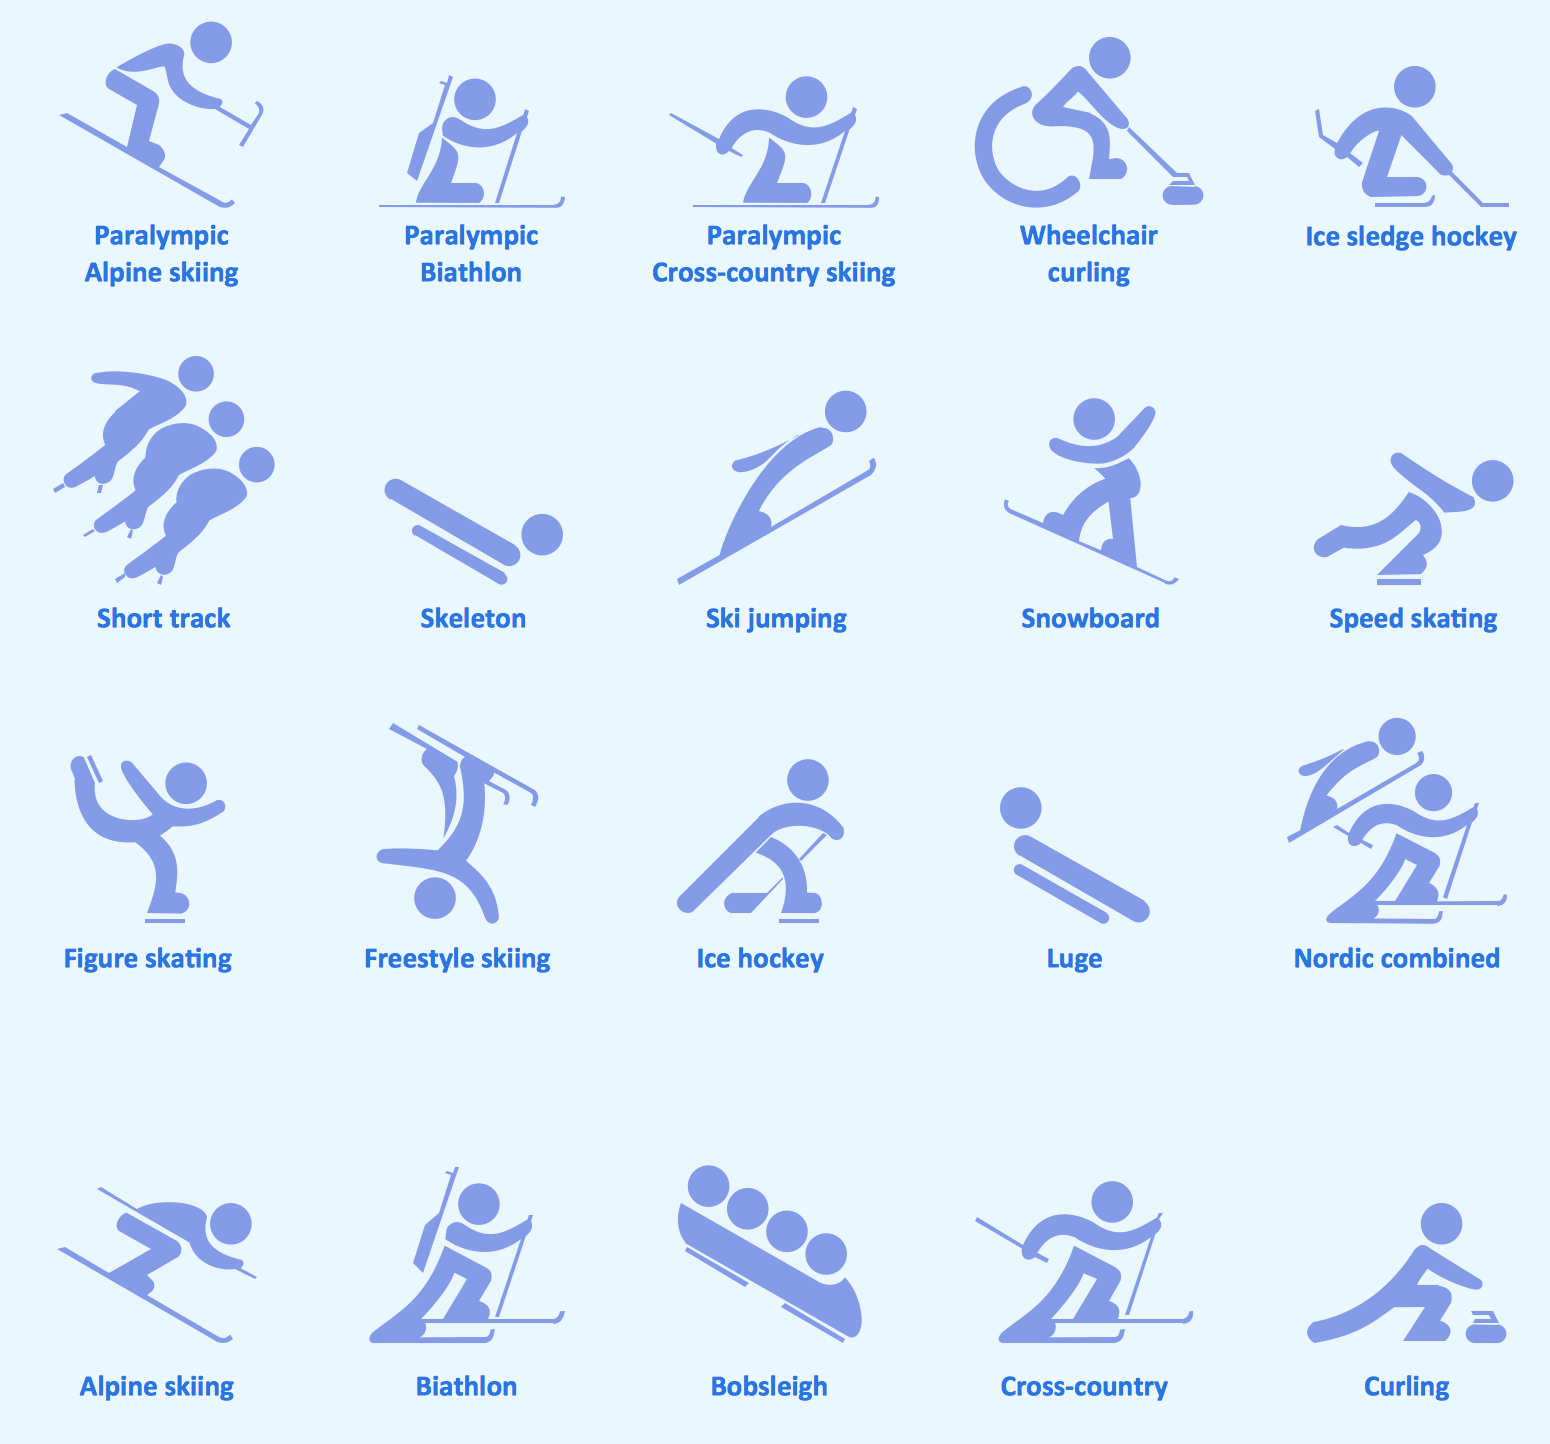
Winter Sports Vector Clipart. Medal Map. Spatial Infographics

Tracking Olympic results in visual format is the most modern way to deliver statistics to a broad audience. This is a good example of an illustrated table you may easily modify, print, or publish on web from ConceptDraw Winter Sports solution.

HR Flowchart Symbols

A comprehensive selection of predesigned vector stencils libraries allow you to create eye-catching infographics relating to any human resource management process. Also included are standardized hr flowchart symbols, meaning your diagrams will be relevant and understood by all business associates.

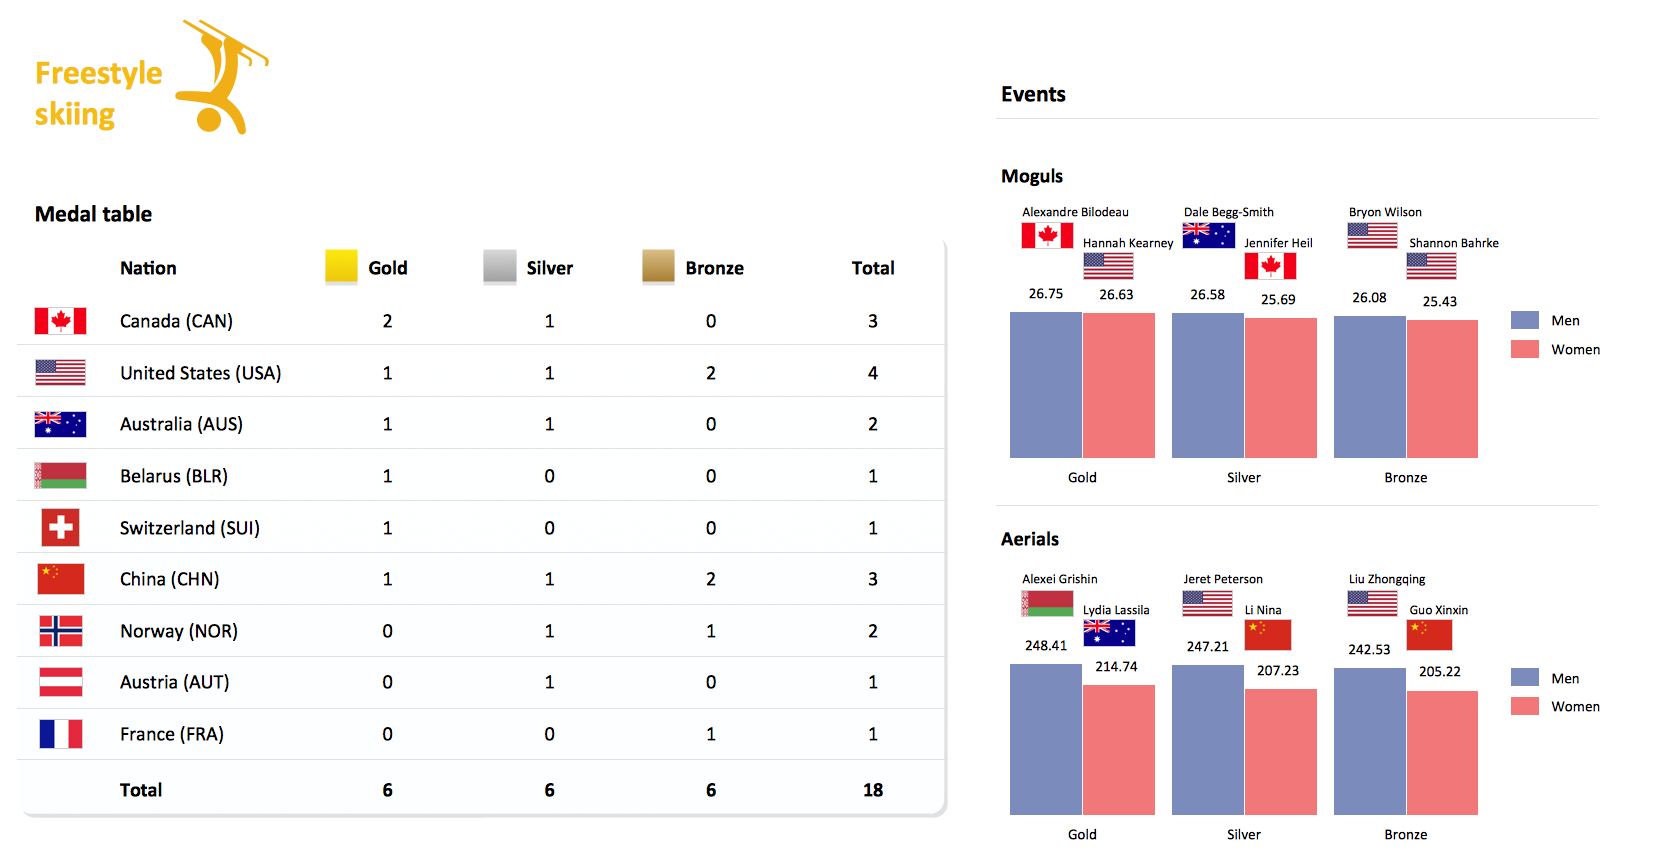
Winter Sports. Olympic Games Illustrations. Medal Summary

Do you like infographics and data visualization? Creating infographics is super-easy with ConceptDraw.

Hazard Pictograms

ConceptDraw DIAGRAM diagramming and vector drawing software enhanced with GHS Hazard Pictograms Solution from the Industrial Engineering Area of ConceptDraw Solution Park offers the GHS Hazard Pictograms library with whole set of predesigned standard Hazard pictograms for easy designing professional-looking Chemical safety infographics and Hazard diagrams.

How to Draw Pictorial Chart. How to Use Infograms

How to draw pictorial chart quick, easy and effective? ConceptDraw DIAGRAM offers the unique Pictorial Infographics Solution that will help you!
Pictorial Infographics solution contains large number of libraries with variety of predesigned vector pictograms that allows you design infographics in minutes. There are available 10 libraries with 197 vector pictograms.

Design Pictorial Infographics. Design Infographics

In the course of recent decades data visualization went through significant development and has become an indispensable tool of journalism, business intelligence and science. The way visual information may be conveyed is not limited simply to static or dynamic representation, it can also be interactive. Infographics can be conditionally divided into several general levels. Primarily, this is level of visualization of information, its interpretation and association on any ground. Second level can be defined as a visualization of knowledge, depiction of thoughts and ideas in the form of images or diagrams. Finally, the level of data visualization, which processes data arrays in charts, enabling the information to be more clearly perceived. You can also identify the main approaches to the creation of infographics: exploratory and narrative. Exploratory method insists on minimalist design in favor of data precision without unnecessary details and is common for scientific researches and ana